UnitedHealth (UNH) Stock Falls 0.40% on Friday, Momentum Weakens
Technical analysis of UNH stock on November 6, 2026: price 394.15 USD, trend sideways, RSI 46.2, support 377.76, resistance 424.98.
UnitedHealth Group (UNH) shares closed at $394.15 on the New York Stock Exchange on Friday, November 6, 2026, down 0.40% on the day. They are down 3.15% over five days but still up 3.92% over one month. The stock sits just below its 20-day average, and the details show a pullback with unfinished business.
Trend & Price Action
The trend reads as sideways. The 20-day average (SMA20) stands at $404.82 and the price is below it, while the 50-day average (SMA50) at $390.65 sits just under the price. The 20-day average rose 1.54% over five days, so the short-term slope is mildly upward even though the stock has slipped. No new moving-average crossover has formed.
Within its 20-day range of $377.76 to $424.98, the stock sits about 35% of the way up. The three-month range runs from a low of $362.60 to a high of $426.55. The pattern is a pullback inside a broader range. Buyers have not been strong enough to push the price back above the $404.82 average, and sellers have not broken the lower half of the range.
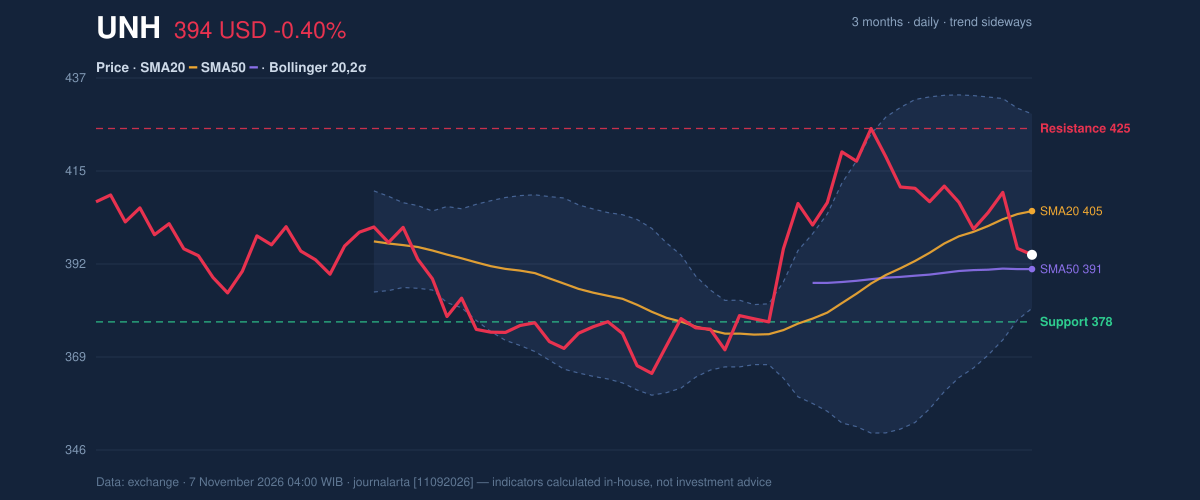
As the chart shows, the price is sandwiched between the 50-day average beneath it and the 20-day average above. The 20-day resistance of $424.98 sits close to the three-month high, so that zone is a ceiling that has already held once.
Oscillators & Momentum
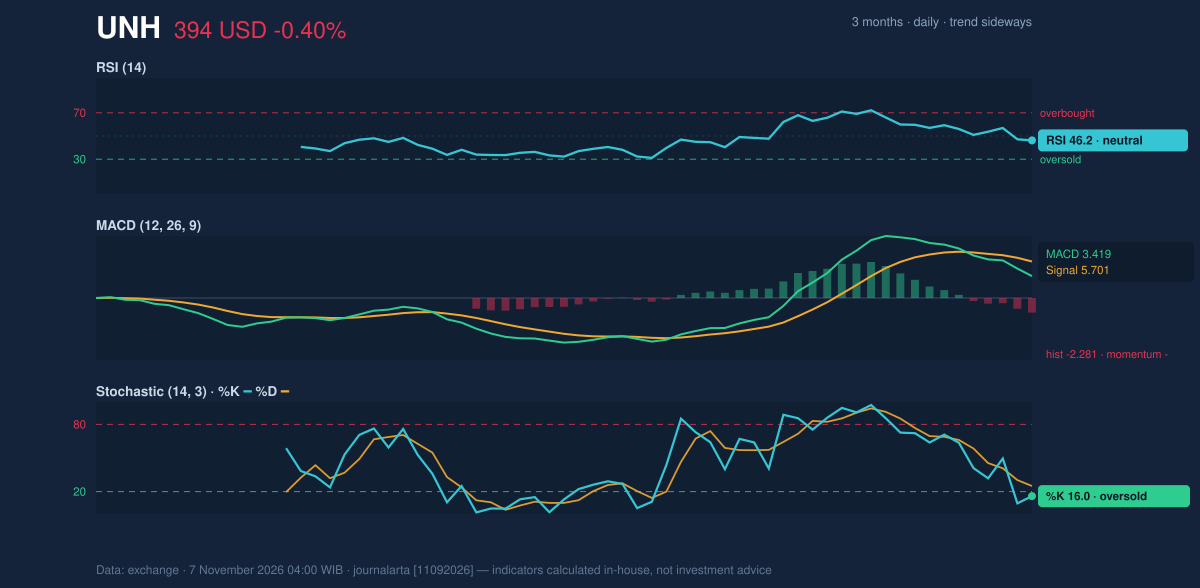
Momentum indicators disagree, which fits a stock without a clear direction. The Relative Strength Index (RSI), which measures how fast prices have recently risen or fallen on a 0–100 scale, is at 46.2, neutral. The Stochastic oscillator, which compares the close with the recent trading range, is at %K 16.0 and %D 25.0, oversold. A reading that low suggests the recent drop has been steep relative to the range. It often precedes a bounce, but it does not guarantee one.
The MACD, a gauge of trend momentum built from two moving averages, is more cautious. The line is at 3.419 against a signal line of 5.701, leaving a histogram of -2.281, negative momentum. Put together, the oversold Stochastic hints at short-term exhaustion of selling, while the MACD says the broader push is still pointing down.
Volatility & Volume
The Bollinger Bands, which draw a channel two standard deviations around the 20-day average, run from $381.09 at the bottom to $428.55 at the top. The price is at a %B of 28%, meaning it sits in the lower part of the channel. The band width of 11.7% is normal, so there is no squeeze signalling an imminent breakout. The Average True Range (ATR), a measure of typical daily movement, is 11.98, about 3.0% of the price. That points to moderate swings of roughly $12 a day.
Volume offers no strong confirmation. Friday's 5,902,200 shares were close to the 20-day average of 6,114,885, or 1.0 times normal. On-balance volume, which tracks whether volume flows with up days or down days, is falling. That suggests slightly more participation on declines than on gains, which supports the cautious momentum reading.
Fundamental Context
According to its SEC filing, UnitedHealth reported quarterly revenue of $112.69 billion for the quarter ended September 30, down 0.4% from $113.16 billion a year earlier (Form 10-Q filed November 3). Net income was $4.11 billion, compared with $2.35 billion a year earlier, and diluted earnings per share were $4.56. Profit rose sharply while revenue was flat. The filing does not by itself explain the five-day slide in the share price.
Key Levels & Scenarios
Support is the first level to watch. The 20-day support at $377.76 lies just below the lower Bollinger Band at $381.09, and the 1.5×ATR level below the price is $376.17. A close under that cluster would put the $362.60 three-month low back in play. On the upside, a move back above the 20-day average at $404.82 would repair the short-term structure, with $424.98 as the next ceiling. A close above it would open the way to the 3-month high of $426.55.
Technical Verdict: HOLD (wait & see)
The code-computed technical bias is neutral, with 1 of 7 bullish signals and none of the 7 bearish ones. The verdict is HOLD (wait & see), for three reasons:
- Mixed momentum: the Stochastic at 16.0 is oversold, but the MACD histogram at -2.281 is negative.
- No trend edge: the trend is sideways, the price is below the SMA20 at $404.82 and above the SMA50 at $390.65, and no new crossover has formed.
- Soft participation: on-balance volume is falling and volume was about 1.0 times average.
The verdict is invalidated if the price falls below the 20-day support of $377.76.
- Ideal entry range: $377.76–$381.09, the 20-day support and the lower Bollinger Band.
- Exit target: $404.82 (the 20-day average), then $424.98 (20-day resistance).
- Stop loss: below $376.17 (price minus 1.5×ATR).
In plain terms, UnitedHealth is stuck between a floor near $378 and a ceiling near $425, so the chart gives no clear direction yet. The next test is whether the stock can climb back above its 20-day average.
Summary Data UNH
| Last price | 394.15 USD |
| Change 1 day / 5 days / 1 month | -0.40% / -3.15% / 3.92% |
| Trend / MA-cross | sideways / none |
| SMA20 / SMA50 | 404.82 / 390.65 |
| RSI (14) / Stochastic %K | 46.2 / 16.0 |
| Bollinger %B / ATR | 28% / 11.98 |
| Support / Resistance 20 days | 377.76 / 424.98 |
| Data as of | 7 November 2026 04:00 WIB |
Disclaimer: This technical analysis is generated automatically from exchange data and indicators calculated by JournalArta, for information and education only. The verdict and the entry, target and stop-loss levels are not investment advice or a solicitation to buy or sell any security. Investment decisions and their risks rest solely with the reader.
Track UNH stock price daily: live levels, support/resistance and our full UNH analysis history.