Technical analysis of MSTR stock on November 6, 2026: price 128.93 USD, trend downtrend, RSI 41.5, support 128.93, resistance 153.48.
By Alistair Sterling
November 9, 20264 min read
Advertisement
Logo Strategy (MicroStrategy) — JournalArta illustration
Why MSTR is in focus today
Fresh death cross: SMA20 crossed below SMA50
Downtrend extending (5-day change -1.21%)
Not covered by JournalArta in the last 14 days
Selected automatically from 100 NASDAQ (US) stocks by a technical-signal score with daily weighted randomisation — not a recommendation.
Strategy Inc. (MSTR), the Nasdaq-listed bitcoin-treasury and software company, closed Friday's session on November 6, 2026 at $128.93, exactly on its 20-day support floor. The stock is nearly 16.5% lower than a month ago, and a fresh technical warning has appeared on its chart.
That warning is a death cross. The 20-day average crossed below the 50-day average two sessions before the latest session. Strategy slipped 0.29% on the day and 1.21% over five days, but 16.46% over one month. The size of the monthly drop matters more than the small recent moves.
Trend and Price Action
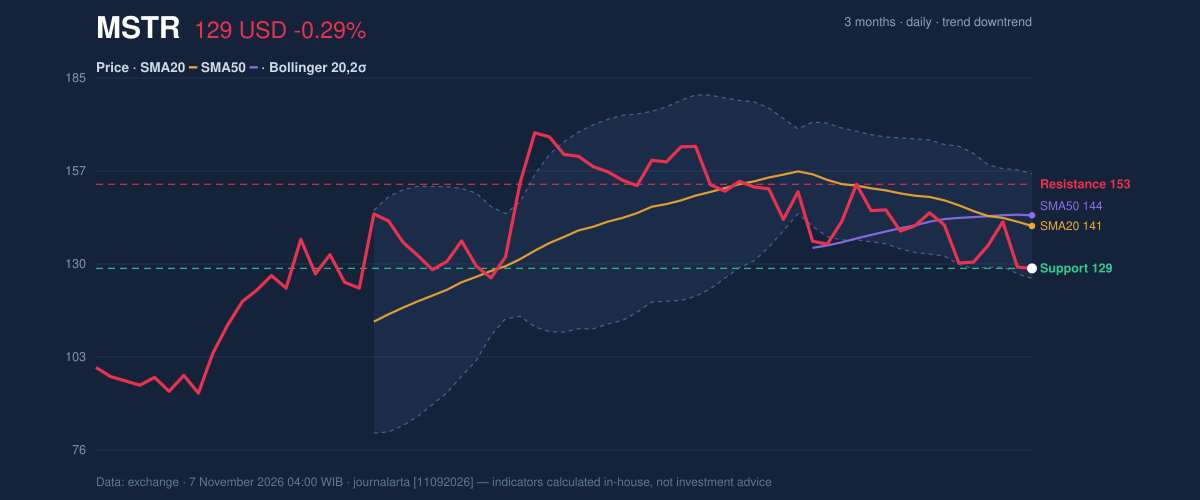
A death cross happens when a short-term average of closing prices falls through a longer-term one. It does not predict anything by itself. It confirms that recent prices have been lower than older ones for a while. Here the 20-day average sits at 141.30 and the 50-day at 144.43, and the price is below both. The 20-day average fell 4.11% over five days, so the downward pressure is still building.
The chart shows the pattern. Each rally has stalled near the falling 20-day line instead of pushing through it.
3-month price action chart of MSTR: price, SMA20/50, Bollinger, support & resistance.
Advertisement
The 20-day range runs from support at 128.93 to resistance at 153.48, and the price sits at 0% of that range. The wider picture is a swing: the three-month high is 171.19 and the low is 91.67. The stock is far from both extremes and trades in a wide middle band.
Oscillators and Momentum
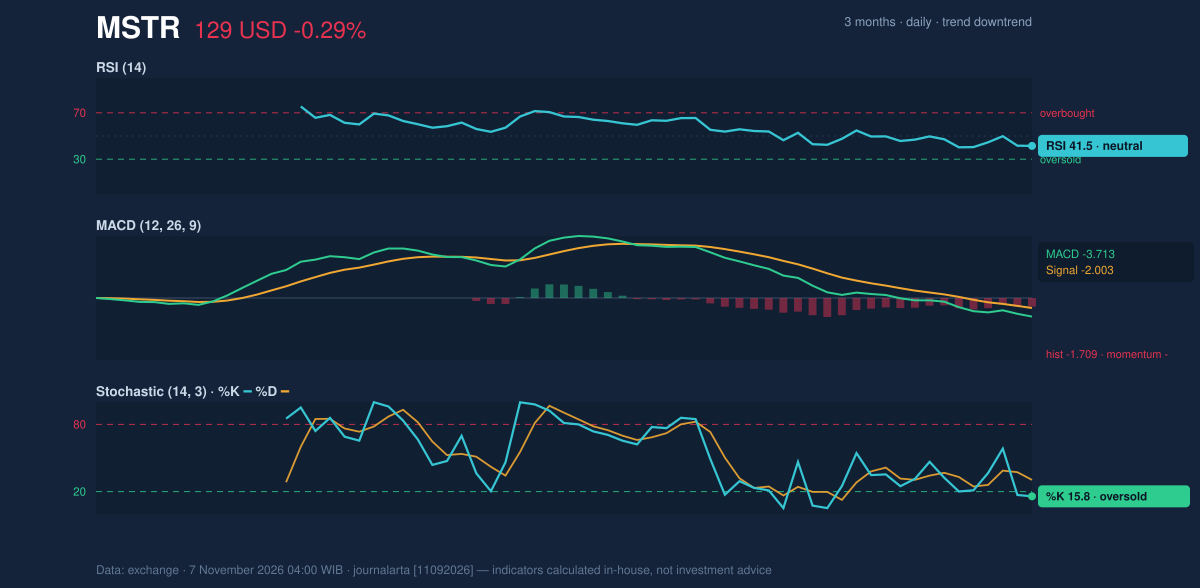
Momentum indicators disagree about how bad things are. The 14-day RSI, a gauge of how strongly buyers or sellers have dominated recent sessions, reads 41.5, which is neutral. The Stochastic oscillator, which compares the close with its recent range, is more extreme. Its %K line is at 15.8 and %D at 30.4, both in oversold territory.
Oversold readings show that the stock closed near the bottom of its recent range. They do not show that a rebound is due. In a downtrend, an oversold Stochastic can stay low for a long time.
The MACD, which tracks the gap between fast and slow averages, is firmly negative. It stands at -3.713 against a signal line of -2.003, and the histogram is -1.709. The gap between the two lines is still wide, so sellers retain control of the trend.
Momentum chart of MSTR: RSI(14), MACD, Stochastic.
Advertisement
Volatility and Volume
The Bollinger Bands show the stock near the bottom of its envelope. The price sits at 10% of the band width (%B), just above the lower band at 126.02. The bands span 21.6% of the price and are widening, which means the swings are getting larger. The 14-day average true range (ATR), a measure of the typical daily move, is 9.75, or 7.6% of the price. A move of that size in one day is routine for this stock.
Volume gives the first mild counterpoint. Friday's 13,822,700 shares were 0.8 times the 20-day average of 18,131,605. Selling that fades on light volume is usually less forceful than a rush for the exits. Even so, on-balance volume (OBV), which adds volume on up days and subtracts it on down days, keeps falling. That shows more shares changing hands on declines than on gains.
Fundamental Context
According to its SEC filing, Strategy reported quarterly revenue of $125.4 million for the quarter ended September 30, down 2.5% from $128.7 million a year earlier (Form 10-Q filed November 2). Net income was $19.53 billion, against $2.79 billion a year earlier, with diluted earnings of $44.75 per share. Profit that far exceeds revenue means the result did not come from selling software. It also did not stop the share price from falling afterward. The company filed a Form 8-K on November 2 reporting a Regulation FD disclosure and other material events, and another on October 29 covering a shareholder vote.
Advertisement
Technical Verdict: SELL
The code-computed bias is bearish, with three bearish signals and none bullish. The verdict follows that reading: SELL, as a technical stance only.
- The death cross, formed two sessions before the latest session, with the price below both averages.
- The MACD sits below its signal line with a negative histogram of -1.709.
- Falling OBV confirms the downtrend.
Levels, all taken from the data:
- Entry range: a bounce from the current 128.93 toward the 20-day average at 141.30.
- Exit target: the 20-day support at 128.93, extending to the 3-month low of 91.67 if that floor gives way.
- Stop loss: above 143.55, which is price plus 1.5 times the ATR.
The verdict is invalidated if the price closes above the 50-day average at 144.43.
This is technical analysis, not an investment recommendation. In plain terms, the chart favors further weakness over a recovery, and the 128.93 floor, where Friday's close landed, is the line to watch.
Summary Data MSTR
Last price
128.93 USD
Change 1 day / 5 days / 1 month
-0.29% / -1.21% / -16.46%
Trend / MA-cross
downtrend / death
SMA20 / SMA50
141.30 / 144.43
RSI (14) / Stochastic %K
41.5 / 15.8
Bollinger %B / ATR
10% / 9.75
Support / Resistance 20 days
128.93 / 153.48
Data as of
7 November 2026 04:00 WIB
Advertisement
Disclaimer: This technical analysis is generated automatically from exchange data and indicators calculated by JournalArta, for information and education only. The verdict and the entry, target and stop-loss levels are not investment advice or a solicitation to buy or sell any security. Investment decisions and their risks rest solely with the reader.