Prologis (PLD) Stock on Friday: Falls 1.24%, Momentum Gains
Technical analysis of PLD stock on November 6, 2026: price 126.96 USD, trend sideways, RSI 44.2, support 124.09, resistance 133.55.
Prologis (NYSE: PLD) closed at $126.96 on Friday, November 6, 2026, down 1.24% from a previous close of $128.55, according to exchange data. The warehouse real estate trust has slipped 0.80% over five days and 1.95% over one month. It had not been covered by JournalArta in the past 14 days. The drift is gentle, but the indicators suggest a stock waiting for a catalyst.
Trend & Price Action
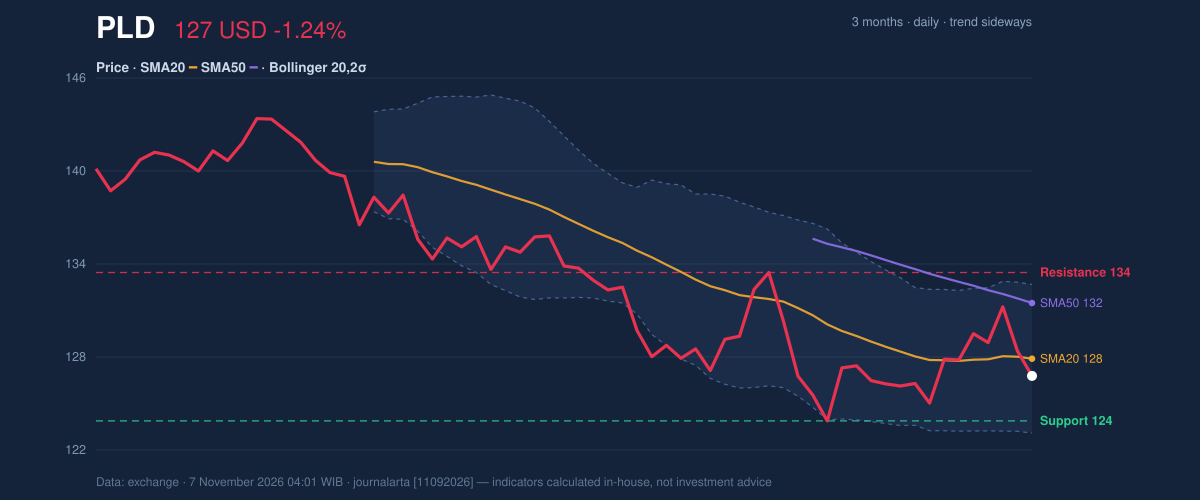
The trend reads as sideways. The 20-day average rose just 0.11% over five days, so it is almost flat. Price sits below the 20-day average of $128.05, which in turn sits below the 50-day average of $131.60. When the shorter average trails the longer one, recent buyers have been paying less than earlier buyers. That points to hesitation, not panic. No new moving-average crossover has formed.
As shown in the chart, the stock sits at about 30% of its 20-day range, between support at $124.09 and resistance at $133.55. The three-month range is wider, with a high of $143.82 and a low of $123.43. The stock is trading near the bottom of that band, well below the peak.
Support is a price zone where buyers have recently stepped in. Resistance is where sellers have recently capped rallies. Prologis is hovering much closer to the first than the second.
Oscillators & Momentum
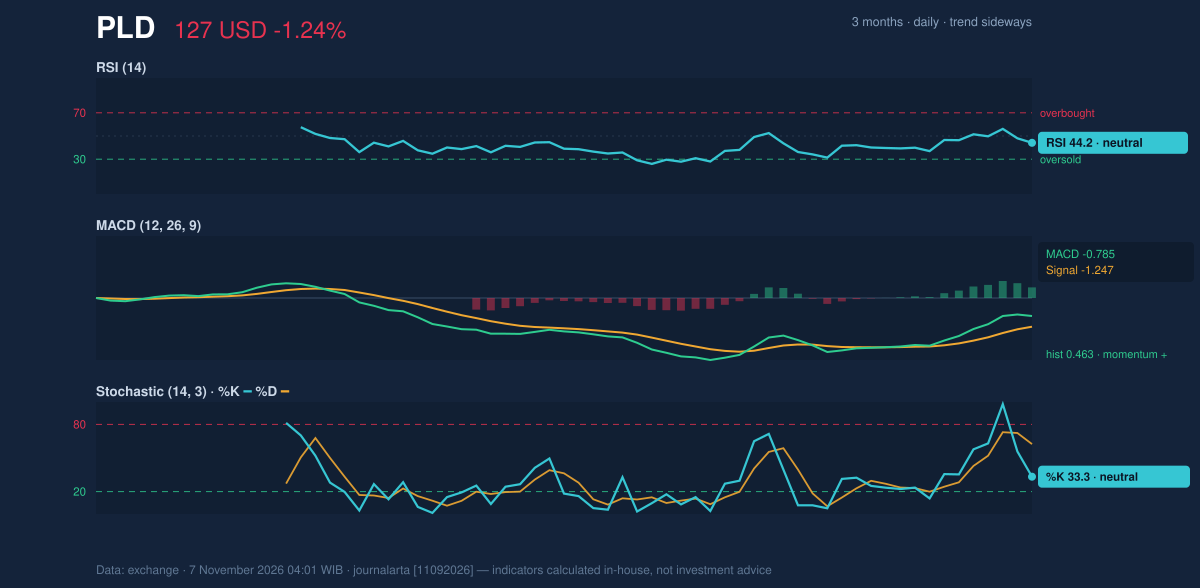
Momentum gauges are mixed. The 14-day Relative Strength Index (RSI), which measures the speed of recent gains against losses, stands at 44.2. That is neutral, slightly on the weak side of the 50 midpoint. The Stochastic oscillator, which compares the close with the recent trading range, shows %K at 33.3 against %D at 62.4. The faster line is below the slower one, so short-term momentum is soft, though neither reading is in oversold territory.
The MACD, a trend-following gauge built from two moving averages, offers the one counterweight. The line is at -0.785, below its signal line at -1.247, but the histogram is +0.463. A positive histogram means downward pressure is fading, even though the MACD has not turned bullish.
Downtrend momentum is easing. An upturn has not begun.
Volatility & Volume
The Bollinger Bands, which draw a channel two standard deviations around the 20-day average, have narrowed to a width of 7.4%. Traders call this a squeeze, because tight bands often precede a larger move. The squeeze does not indicate direction. The upper band is at $132.79, the lower band at $123.31, and the %B reading of 38% puts price slightly below the middle of the channel.
The Average True Range (ATR), a measure of typical daily movement, is $2.50, or 2.0% of the price. That is moderate volatility. A band squeeze combined with moderate ATR suggests the market is coiling, not yet moving.
Participation is lukewarm. Friday's volume was 3,333,400 shares, about 0.8 times the 20-day average of 4,222,225. On-balance volume (OBV), which tallies volume on up days against down days, is falling. Light trading on a down day is less worrying than heavy selling, but a falling OBV means volume has not confirmed any recovery.
Filing Context
Prologis filed a Form 8-K with the U.S. Securities and Exchange Commission on October 30, 2026, reporting other material events, according to its SEC filing. The filing's listing does not by itself say what the event was, and this analysis does not draw conclusions from it. The technical picture below rests on price and volume alone.
Key Levels & Scenarios
Two scenarios matter. If price loses $124.09 and then the three-month low of $123.43, the sideways pattern would give way to a fresh downside phase. If it reclaims the 20-day average at $128.05 and holds, the next reference is resistance at $133.55, and above that the three-month high of $143.82.
Technical Verdict: HOLD
The code-computed technical bias is neutral, with none of seven bullish or bearish signals triggered. The verdict is HOLD (wait & see), for three reasons:
- Trend: price is below the 20-day average and the 20-day average is below the 50-day, but the 20-day slope is nearly flat.
- Momentum: RSI at 44.2 and Stochastic %K at 33.3 are neutral, while the MACD histogram at +0.463 shows selling pressure easing.
- Volatility and volume: the Bollinger squeeze at 7.4% signals a coming move, but falling OBV and 0.8× normal volume give no direction.
For reference, the levels derived from the data are:
- Ideal entry range: $123.31 to $124.09, the lower Bollinger Band to 20-day support.
- Exit target (target price): $128.05 (20-day average) first, then $133.55 (20-day resistance).
- Stop loss: below $123.20, which is price minus 1.5×ATR and sits just under the three-month low of $123.43.
The verdict is invalidated if price falls below $123.43, or if it closes above $133.55 on rising volume.
In plain terms, Prologis is stuck in the middle with no clear direction, and the data favors waiting for a break above $133.55 or below $123.43 before reading the next move.
Summary Data PLD
| Last price | 126.96 USD |
| Change 1 day / 5 days / 1 month | -1.24% / -0.80% / -1.95% |
| Trend / MA-cross | sideways / none |
| SMA20 / SMA50 | 128.05 / 131.60 |
| RSI (14) / Stochastic %K | 44.2 / 33.3 |
| Bollinger %B / ATR | 38% / 2.50 |
| Support / Resistance 20 days | 124.09 / 133.55 |
| Data as of | 7 November 2026 04:01 WIB |
Disclaimer: This technical analysis is generated automatically from exchange data and indicators calculated by JournalArta, for information and education only. The verdict and the entry, target and stop-loss levels are not investment advice or a solicitation to buy or sell any security. Investment decisions and their risks rest solely with the reader.
Track PLD stock price daily: live levels, support/resistance and our full PLD analysis history.