PDD Stock Analysis: Falls 1.10%, Golden Cross Formed
Technical analysis of PDD stock on November 6, 2026: price 83.03 USD, trend uptrend, RSI 57.8, support 77.47, resistance 83.95.

For global investors watching Chinese e-commerce, PDD Holdings, the parent of Temu and Pinduoduo, has produced a rare technical alignment on NASDAQ. PDD closed at $83.03 on Friday, November 6, 2026, down 1.10% on the day from a previous close of $83.95. It is up 5.62% over five days and 2.07% over one month. The two reasons the stock was flagged this week are a fresh moving-average crossover and an uptrend that has held up.
Why PDD is in focus today
- Fresh golden cross: SMA20 crossed above SMA50
- Uptrend confirmed (5-day change 5.62%)
Selected automatically from 100 NASDAQ (US) stocks by a technical-signal score with daily weighted randomisation — not a recommendation.
Trend & Price Action
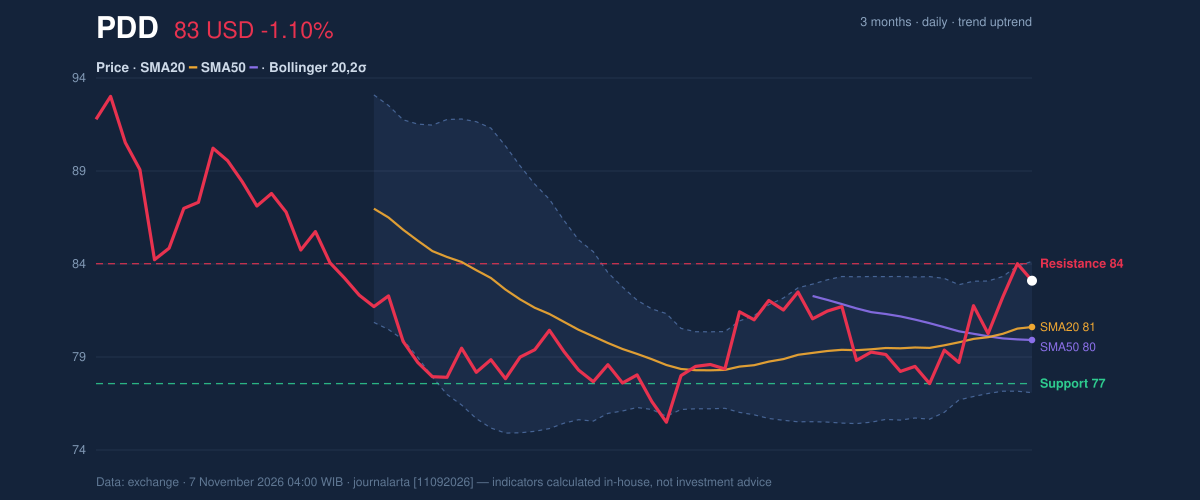
The 20-day simple moving average (SMA20), which averages the last 20 closing prices, sits at $80.53. The 50-day average (SMA50) is at $79.82. A golden cross formed two sessions before the latest session, meaning the faster SMA20 crossed above the slower SMA50. Traders read this as a sign that recent buying is outpacing the longer-term trend. It is not a fresh signal as of Friday: it is two sessions old. The 20-day average has also risen 1.04% over five days, and the price remains above the SMA20, so the trend structure is intact.
Friday's 1.10% slip matters less than where it happened. The stock closed at $83.03, just under the 20-day resistance at $83.95, which is also Thursday's closing level. Within its 20-day range the price sits at 86%, near the top but not through it. Further out, the three-month range runs from a low of $74.72 to a high of $93.19, so the stock has recovered well off the bottom but remains far below the peak, as the chart shows.
Oscillators & Momentum
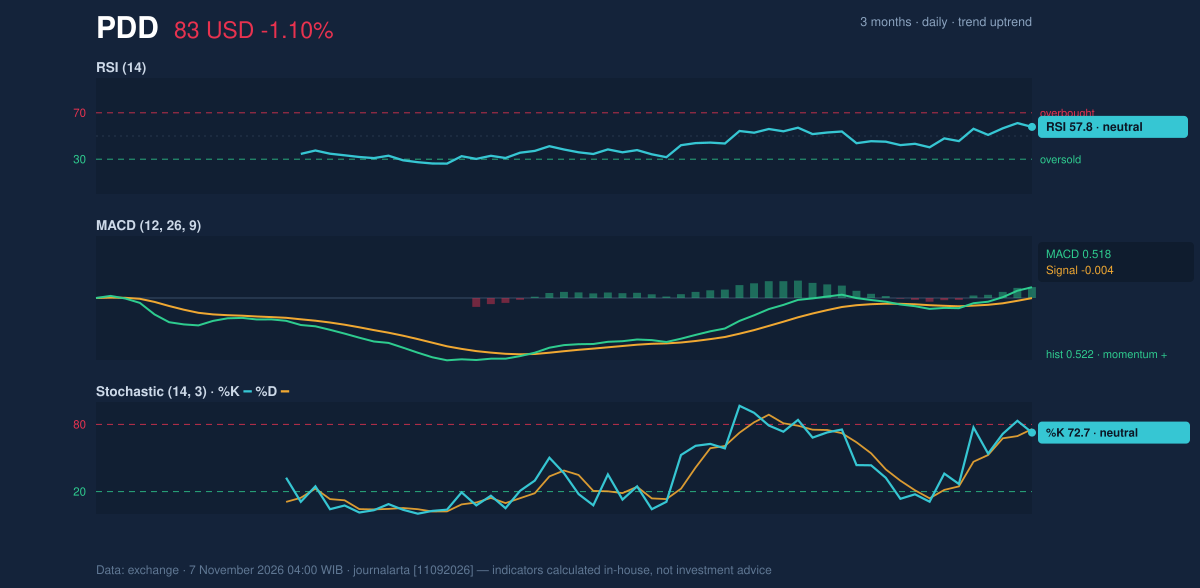
Momentum indicators confirm the trend without showing strain. The Relative Strength Index (RSI), a 0-to-100 gauge of how stretched recent gains are, reads 57.8, which is neutral. Readings above 70 usually suggest a stock has run too hard, too fast. At 57.8 there is room to move higher before that warning appears.
The Stochastic oscillator, which compares the closing price to its recent trading range, shows %K at 72.7 and %D at 75.8, also neutral. With %K below %D, short-term momentum is cooling slightly. That fits a stock pausing just beneath resistance after a 5.62% five-day gain.
The MACD line, which tracks the gap between short- and long-term price averages, stands at 0.518 against a signal line of -0.004. The histogram of 0.522 signals positive momentum. In plain terms, the MACD has moved decisively above its own signal line, adding a second confirmation of the golden cross from a different angle.
Volatility & Volume
The Bollinger Bands, which draw an envelope two standard deviations around the 20-day average, put the upper band at $84.08, the middle at $80.53 and the lower at $76.98. The %B reading of 85% places the price in the upper part of the envelope. A width of 8.8% is described as normal, so there is no squeeze of the kind that often precedes a sharp breakout. The upper band at $84.08 sits only about a dollar above the price and almost on top of the $83.95 resistance, so that area is crowded with overhead barriers.
The Average True Range (ATR), a measure of the typical daily swing, is $2.53, or 3.0% of the price. That is moderate volatility. A move of around 1.5 times that range in either direction, to $79.24 or $86.82, would not be unusual for this stock over a short span.
Participation backs the move. Friday's volume was 6,502,100 shares, about 1.1 times the 20-day average of 5,663,215, and on-balance volume (OBV), a running tally that adds volume on up days and subtracts it on down days, is rising. Money appears to be entering on the way up rather than leaving. The pullback, meanwhile, came on slightly above-average volume, which is worth watching.
Key Levels & Scenarios
The $83.95 resistance is the immediate test. A sustained close above it would open the path toward the three-month high of $93.19, with the upper Bollinger band at $84.08 and the 1.5-times-ATR level of $86.82 as markers on the way. If the stock fails to clear $83.95, the first cushions are the SMA20 at $80.53 and the SMA50 at $79.82. Below those, the 20-day support at $77.47 is the line that separates a routine pullback from a damaged trend.
Technical Verdict: BUY
The code-computed bias is bullish, with three of seven bullish signals and none of seven bearish, so the verdict is BUY on technical grounds. The strongest reasons:
- Golden cross: the SMA20 ($80.53) crossed above the SMA50 ($79.82) two sessions before the latest session, and the price remains above both.
- Momentum: the MACD histogram is positive at 0.522 and the RSI at 57.8 is neutral, so the trend is not overextended.
- Volume confirmation: OBV is rising and volume ran 1.1 times its 20-day average.
The levels below come strictly from the data:
- Ideal entry range: $80.53 to $83.03, from the SMA20 up to the last close.
- Exit target: $83.95, the 20-day resistance. Above it, the next reference is the three-month high of $93.19.
- Stop loss: below $79.24, which is the price minus 1.5 times the ATR.
The verdict is invalidated if the price breaks below the $77.47 20-day support. This is technical analysis, not an investment recommendation, and the site disclaimer applies.
For readers who do not trade: the chart currently leans in the stock's favour, but it has to get past $83.95 before that lean becomes a breakout.
Summary Data PDD
| Last price | 83.03 USD |
| Change 1 day / 5 days / 1 month | -1.10% / 5.62% / 2.07% |
| Trend / MA-cross | uptrend / golden |
| SMA20 / SMA50 | 80.53 / 79.82 |
| RSI (14) / Stochastic %K | 57.8 / 72.7 |
| Bollinger %B / ATR | 85% / 2.53 |
| Support / Resistance 20 days | 77.47 / 83.95 |
| Data as of | 7 November 2026 04:00 WIB |
Disclaimer: This technical analysis is generated automatically from exchange data and indicators calculated by JournalArta, for information and education only. The verdict and the entry, target and stop-loss levels are not investment advice or a solicitation to buy or sell any security. Investment decisions and their risks rest solely with the reader.
Track PDD stock price daily: live levels, support/resistance and our full PDD analysis history.