Salesforce (CRM) Stock Analysis: Falls 3.94%, Testing Support Level
Technical analysis of CRM stock on November 6, 2026: price 213.65 USD, trend downtrend, RSI 33.8, support 213.65, resistance 250.29.
By Elena Vance
November 9, 20265 min read
Advertisement
Logo Salesforce — JournalArta illustration
Why CRM is in focus today
Downtrend extending (5-day change -6.77%)
Not covered by JournalArta in the last 14 days
Selected automatically from 80 NYSE (US) stocks by a technical-signal score with daily weighted randomisation — not a recommendation.
Salesforce (CRM) shares fell 3.94% on the New York Stock Exchange on Friday, November 6, 2026, closing at $213.65 against a previous close of $222.41. The slide is not new. The stock is down 6.77% over five days and 6.76% over one month, and JournalArta has not covered it in the past 14 days.
Trend & Price Action
The price now sits below both moving averages. A moving average is the mean closing price over a set number of days, and it works as a rough gauge of the prevailing trend. The 20-day average is at $236.15 and the 50-day at $239.50. The 20-day average itself rose by a modest 0.52% in the opposite direction only as a slope figure of -0.52% over five days, meaning it is drifting lower. No new crossover between the two averages has formed, so the downtrend has not yet been formalised by a "death cross."
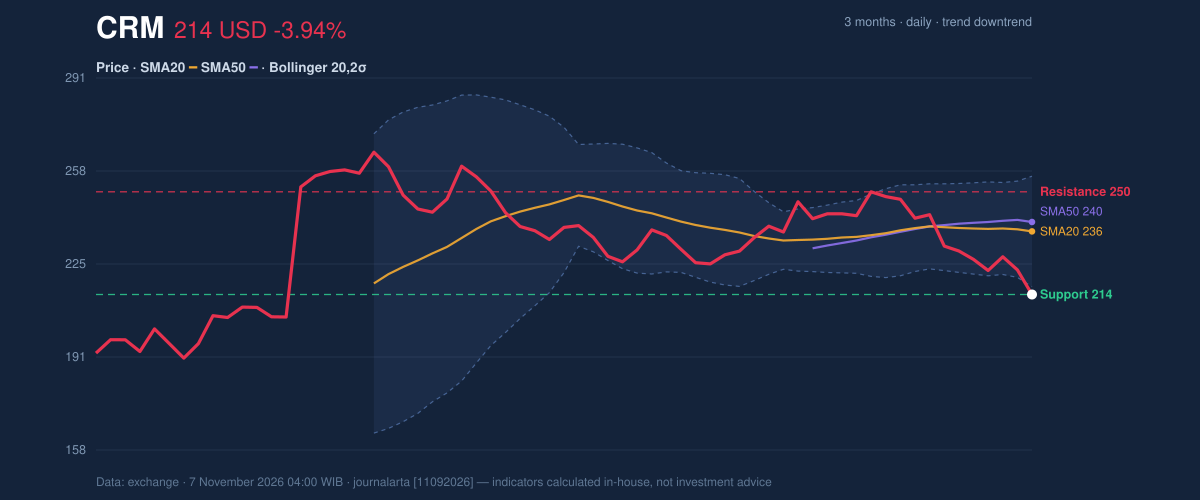
The stock closed exactly at its 20-day support of $213.65, which puts it at the bottom of its 20-day range. The 3-month range runs from $189.91 to $268.27, and the shares now sit well below the midpoint of that band.
3-month price action chart of CRM: price, SMA20/50, Bollinger, support & resistance.
Advertisement
As shown in the chart, the price has slipped through the lower Bollinger band. Bollinger bands draw a channel two standard deviations around the 20-day average. The lower band is at $216.44, and the %B reading of -7% means the close landed outside it. Band width of 16.7% is described as normal, so this is a drift down, not a volatility blowout.
Oscillators & Momentum
Momentum measures speed, not direction, and here it says sellers are in control but possibly stretched.
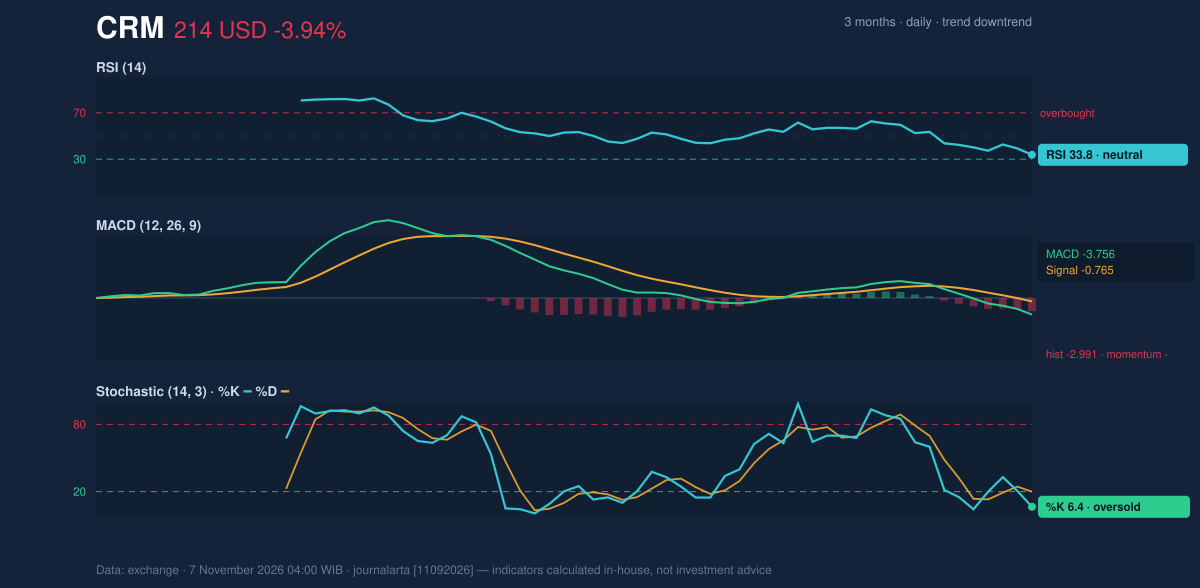
The Relative Strength Index (RSI), which scores recent gains against losses on a 0–100 scale, reads 33.8. That is neutral, not oversold. The Stochastic oscillator is more extreme: %K at 6.4 and %D at 20.0 are both in oversold territory. The Stochastic compares the close with its recent high-low range, so a reading that low says the shares closed near the bottom of their recent range.
The two gauges disagree. The RSI shows selling pressure without exhaustion, while the Stochastic shows a stock pressed to its floor. The MACD, which tracks the gap between short- and long-term averages, adds to the bearish side: it stands at -3.756 against a signal line of -0.765, leaving a histogram of -2.991. Negative momentum is still widening.
Momentum chart of CRM: RSI(14), MACD, Stochastic.
Advertisement
Volatility & Volume
The 14-day Average True Range (ATR), a measure of typical daily swings, is $9.50, or 4.4% of the price. That is high. Daily moves of that size explain how a single session can erase nearly 4%.
Participation is unremarkable. Friday's volume of 6,710,100 shares was 0.9 times the 20-day average of 7,376,680. On-balance volume (OBV), which adds volume on up days and subtracts it on down days, is falling. The drop therefore came without a rush of selling, but the OBV trend confirms that volume has favoured sellers.
Fundamental Context
The weak chart sits against solid company numbers. According to its SEC filing (Form 10-Q, filed August 27, 2026), Salesforce reported quarterly revenue of $11.35 billion for the quarter ended July 31, up 10.8% from $10.24 billion a year earlier. Net income was $3.53 billion, compared with $1.89 billion a year earlier, and diluted earnings per share were $4.29. The price move reflects market sentiment, not a deterioration visible in that filing.
Advertisement
Key Levels & Scenarios
The nearest floor is the 20-day support at $213.65, where the stock closed. A decisive break below it would open the way toward the ATR-based level of $199.40, which is the price minus 1.5 times the ATR, and then the 3-month low of $189.91. If the shares hold and rebound, the first hurdle is the lower Bollinger band at $216.44, followed by the 20-day average at $236.15. The 20-day resistance sits at $250.29.
Technical Verdict: HOLD
The code-computed bias is neutral: none of the seven bullish signals is active and one of seven bearish signals is (falling OBV confirming the downtrend). The verdict is HOLD (wait & see).
- Trend: price is below the 20-day and 50-day averages, and the 20-day slope is -0.52% over five days.
- Momentum split: RSI at 33.8 is neutral, while Stochastic at 6.4 is oversold and MACD remains negative at -2.991 on the histogram.
- Volume: OBV is falling, but volume was only 0.9 times normal.
Reference levels, drawn only from the data:
- Ideal entry range: $199.40 to $213.65, between the ATR-based level and the 20-day support, if the stock stabilises there.
- Exit target: $236.15 (20-day average and Bollinger midline), with $250.29 (20-day resistance) as the extended target.
- Stop loss: below $189.91, the 3-month low.
The verdict is invalidated if price closes below $189.91, which would break the 3-month range, or if it rises above $250.29, which would reverse the short-term downtrend.
In plain terms, the chart shows a stock that has fallen hard but has not yet shown a clear sign of turning, so the data favours waiting.
Advertisement
Summary Data CRM
Last price
213.65 USD
Change 1 day / 5 days / 1 month
-3.94% / -6.77% / -6.76%
Trend / MA-cross
downtrend / none
SMA20 / SMA50
236.15 / 239.50
RSI (14) / Stochastic %K
33.8 / 6.4
Bollinger %B / ATR
-7% / 9.50
Support / Resistance 20 days
213.65 / 250.29
Data as of
7 November 2026 04:00 WIB
Disclaimer: This technical analysis is generated automatically from exchange data and indicators calculated by JournalArta, for information and education only. The verdict and the entry, target and stop-loss levels are not investment advice or a solicitation to buy or sell any security. Investment decisions and their risks rest solely with the reader.