Procter & Gamble (PG) Stock on Friday: Falls 1.02%, Testing Key Resistance
Technical analysis of PG stock on November 6, 2026: price 165.40 USD, trend uptrend, RSI 63.8, support 153.04, resistance 167.32.

Procter & Gamble closed Friday's session (November 6, 2026) at $165.40, down 1.02% on the day from a $167.10 prior close. The pullback is small. It follows a 9.37% gain over one month and a 2.37% rise over five days, so the stock is at the top of its recent range rather than in trouble. That confirmed uptrend, together with the fact that JournalArta has not covered the stock in 14 days, is why PG is on the screen today.
Why PG is in focus today
- Uptrend confirmed (5-day change 2.37%)
- Not covered by JournalArta in the last 14 days
Selected automatically from 80 NYSE (US) stocks by a technical-signal score with daily weighted randomisation — not a recommendation.
Trend & Price Action
The structure is bullish. Price sits above the 20-day simple moving average (SMA20) at $160.23, which in turn sits well above the 50-day average at $152.00. The 20-day average rose 2.61% over five days, a sign the advance has been steady rather than a single jump. There is no new moving-average crossover, so no fresh "golden cross" or "death cross" is driving the story.
Position in the range matters more here. PG trades at about 87% of its 20-day range, between support at $153.04 and resistance at $167.32. The three-month high is $170.52 and the low is $141.86. Friday's close is $1.92 under the 20-day ceiling.
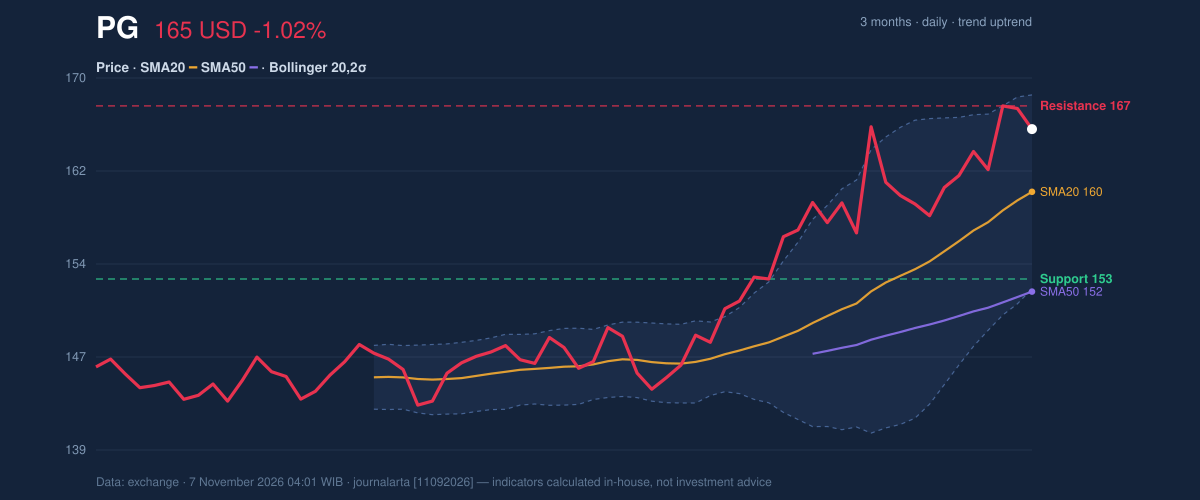
As the chart shows, price hugs the upper half of the Bollinger Bands. These bands are a volatility envelope drawn two standard deviations around the 20-day average. The upper band is at $168.22 and the lower at $152.24. The reading, called %B, is 82%, meaning price is near the top of the envelope but not through it.
Oscillators & Momentum
Momentum is positive but cooling. The 14-day Relative Strength Index (RSI) is 63.8, in neutral territory. RSI measures the pace of recent gains against losses, and readings above 70 usually flag an overheated move. PG has room before that line.
The Stochastic oscillator is less flattering. Its fast line (%K) is at 62.7, below its slower signal line (%D) at 76.8. When the fast line sits under the slow one after a strong run, buying pressure is usually fading. It is a pause signal, not a reversal.
The MACD, a trend-following gauge built from two moving averages, still leans positive. It reads 3.998 against a signal line of 3.673, a histogram of 0.326. The gap is thin.
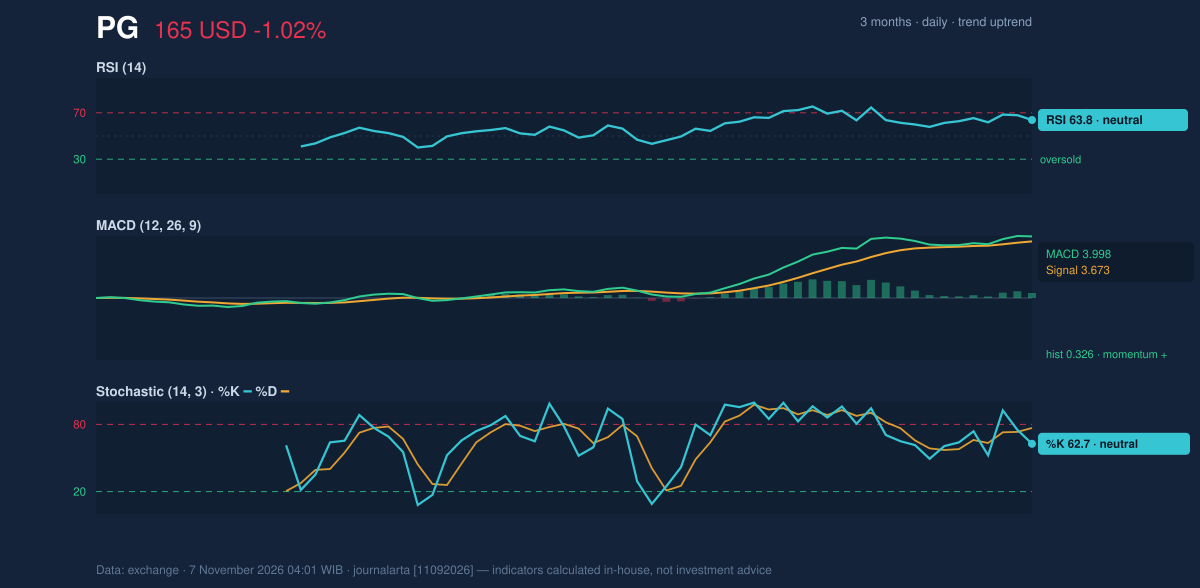
Taken together, the trend indicators say "up" while the shorter-term oscillators say "slowing." That mix is typical of a stock digesting gains.
Volatility & Volume
The Bollinger Bands are 10.0% wide, which the data classes as normal, so there is no squeeze pointing to an imminent breakout. The 14-day Average True Range (ATR), a measure of typical daily movement, is $3.81, or 2.3% of the price. That is moderate volatility: a move of a few dollars in either direction is routine for PG.
Participation is the weak spot. Friday's volume was 7,875,300 shares, about 0.7 times the 20-day average of 10,748,810. On-balance volume (OBV), which tallies volume on up days against down days, is falling. A rally that rises on thin trading and falling OBV has less conviction behind it.
That is the central tension in PG's chart.
Fundamental Context
According to its SEC filing (Form 10-Q, filed October 22), P&G reported quarterly revenue of $23.28 billion for the quarter ended September 30, up 4.0% from $22.39 billion a year earlier. Net income was $4.73 billion, against $4.75 billion a year earlier, with diluted earnings per share of $1.97. Sales grew while profit was essentially flat. The company also filed Form 8-Ks on November 2 and November 3 reporting other material events; the filings' details are not covered here.
Key Levels & Scenarios
The nearest ceiling is the 20-day resistance at $167.32, just above the last price. A close above it would put the $168.22 upper Bollinger Band and then the three-month high of $170.52 in play. The ATR-based upper marker, price plus 1.5 times ATR, is $171.11.
On the downside, the first cushion is the 20-day average at $160.23, close to the ATR-based lower marker of $159.69. If that zone fails to hold, the 20-day support at $153.04 comes into view, near the lower Bollinger Band at $152.24.
Technical Verdict: HOLD
The code-computed technical bias is neutral: one bullish signal (a pullback toward the SMA20 inside an uptrend) against one bearish signal (RSI rolling over from above 65). The verdict is HOLD (wait & see).
- Trend: price above the SMA20 and SMA50, with a rising 20-day average, keeps the bigger picture constructive.
- Momentum: Stochastic %K (62.7) under %D (76.8) and an RSI of 63.8 off its highs suggest the push is losing steam.
- Participation: volume at 0.7 times average with falling OBV does not confirm a breakout.
The verdict is invalidated if price closes below the 20-day support at $153.04 (to the downside) or above the three-month high of $170.52 on stronger volume (to the upside).
- Ideal entry range: $159.69–$160.23 (ATR-based marker to SMA20)
- Exit target: $167.32 (20-day resistance), then $170.52 (three-month high)
- Stop loss: below $153.04 (20-day support)
In plain terms: PG is in a healthy uptrend but looks tired near the top of its range, so the chart favors waiting for a pullback or a high-volume breakout rather than acting now.
Summary Data PG
| Last price | 165.40 USD |
| Change 1 day / 5 days / 1 month | -1.02% / 2.37% / 9.37% |
| Trend / MA-cross | uptrend / none |
| SMA20 / SMA50 | 160.23 / 152.00 |
| RSI (14) / Stochastic %K | 63.8 / 62.7 |
| Bollinger %B / ATR | 82% / 3.81 |
| Support / Resistance 20 days | 153.04 / 167.32 |
| Data as of | 7 November 2026 04:01 WIB |
Disclaimer: This technical analysis is generated automatically from exchange data and indicators calculated by JournalArta, for information and education only. The verdict and the entry, target and stop-loss levels are not investment advice or a solicitation to buy or sell any security. Investment decisions and their risks rest solely with the reader.
Track PG stock price daily: live levels, support/resistance and our full PG analysis history.