Paychex (PAYX) Stock Falls 2.04% on Friday, Golden Cross Formed
Technical analysis of PAYX stock on November 6, 2026: price 117.06 USD, trend uptrend, RSI 58.6, support 104.64, resistance 119.50.
By matthew jonathan
November 9, 20265 min read
Advertisement
Logo Paychex — JournalArta illustration
Why PAYX is in focus today
Fresh golden cross: SMA20 crossed above SMA50
Uptrend confirmed (5-day change 4.41%)
Not covered by JournalArta in the last 14 days
Selected automatically from 100 NASDAQ (US) stocks by a technical-signal score with daily weighted randomisation — not a recommendation.
Paychex (PAYX) slipped 2.04% to $117.06 in the Nasdaq session of Friday, November 6, 2026, but the same session produced a golden cross: the 20-day average moved above the 50-day average. The stock has gained 4.41% over five days and 12.58% over one month, and JournalArta has not covered it in the past 14 days.
The pullback began from $119.50, the previous close and also the 20-day resistance level. Sellers met the stock at the top of its recent range, yet the trend structure survived the retreat.
Trend & Price Action
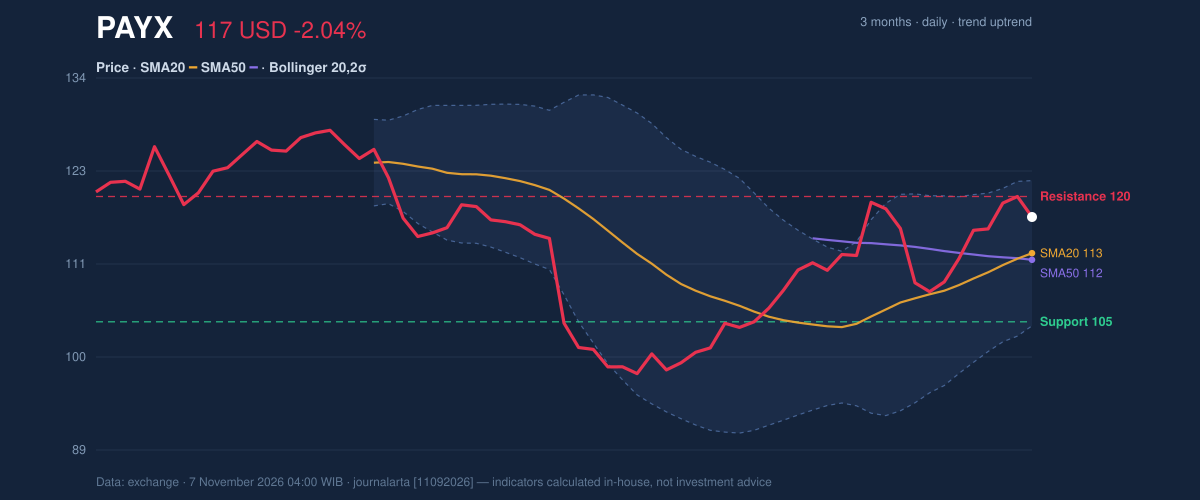
A golden cross happens when a shorter moving average rises through a longer one. It tells traders that recent prices are now higher, on average, than prices over the longer window. The 20-day average sits at $112.77 and the 50-day at $112.00. The gap is only $0.77, so the signal is thin. It confirms that momentum has turned up but does not by itself say how far the move can run.
The 20-day average rose 3.47% over five days, which shows the advance is broad-based rather than a single-day spike. Price sits above the 20-day line, and at 84% of its 20-day range the stock is near the top but not stretched against its 3-month high of $127.98. The 3-month low is $98.00.
As shown in the chart, price has pulled back toward the 20-day line within an uptrend, a pattern often read as a pause rather than a reversal while the longer average stays underneath.
3-month price action chart of PAYX: price, SMA20/50, Bollinger, support & resistance.
Advertisement
Oscillators & Momentum
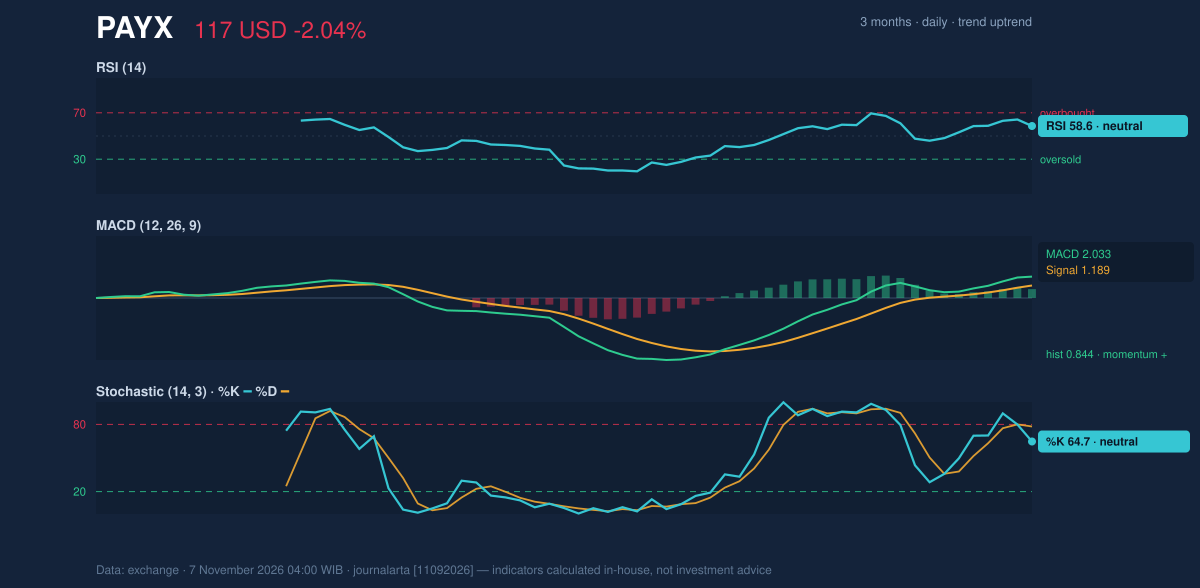
Momentum indicators are neutral, not overheated. The RSI (Relative Strength Index, which compares recent gains with recent losses) reads 58.6, comfortably between the oversold and overbought zones. That leaves room for further gains without the stock looking exhausted.
The Stochastic oscillator shows %K at 64.7 against %D at 78.2. The faster line sitting below the slower one reflects Friday's dip, and it hints at short-term cooling rather than a trend break.
The MACD (a gauge of the gap between short- and long-term price averages) is at 2.033 against a signal line of 1.189. The histogram of 0.844 is positive, so upward momentum still outweighs the drag from Friday's decline. As the chart shows, MACD above its signal line agrees with the moving-average cross.
Momentum chart of PAYX: RSI(14), MACD, Stochastic.
Volatility & Volume
The Bollinger Bands (a channel drawn two standard deviations around the 20-day average) run from $104.17 to $121.38. Price sits at a %B of 75%, meaning it is in the upper part of the band but not touching it. Band width of 15.3% is normal, so there is no squeeze signaling an imminent breakout.
The ATR (Average True Range, the typical daily swing) is 3.89, or 3.3% of price. That implies moderate volatility: a move of a few dollars in either direction would be ordinary.
Participation was light. Friday's volume of 2,508,600 shares was 0.8 times the 20-day average of 2,966,405. A decline on below-average volume suggests the selling lacked conviction. On-balance volume, which tracks whether volume flows with up days or down days, is rising and supports the uptrend.
Advertisement
Fundamental Context
According to its SEC filing (Form 10-Q, filed September 24, 2026), Paychex reported quarterly revenue of $1.58 billion for the quarter ended August 31, 2026, up 5.9% from $1.49 billion a year earlier. Net income was $429.7 million versus $383.8 million a year earlier, and diluted earnings per share were $1.21. Earnings growing faster than revenue gives the technical advance some fundamental backing.
Key Levels & Scenarios
Resistance sits at $119.50, the level that capped Friday's retreat. A sustained move above it would bring the 3-month high of $127.98 into view. On the downside, the 50-day average at $112.00 and the 20-day average at $112.77 form a cluster of nearby support, followed by the 20-day support at $104.64. A price 1.5 times the ATR below the current level works out to $111.22, while 1.5 times above is $122.90.
Technical Verdict: BUY
The code-computed bias is bullish, with three of seven bullish signals and none of seven bearish. The verdict on technical grounds is BUY, based on:
- Golden cross: the 20-day average crossed above the 50-day average on the latest session.
- MACD: positive histogram of 0.844 with the line above its signal, alongside a neutral RSI of 58.6 that leaves room to rise.
- Volume: rising OBV, and a dip on 0.8 times normal volume, point to weak selling pressure.
Reference levels, drawn only from the indicators above:
- Entry range: $112.77 (20-day average) to $117.06 (last price)
- Exit target: $119.50 (20-day resistance), then $127.98 (3-month high) if cleared
- Stop loss: below $111.22 (price minus 1.5×ATR), just under the 50-day average
The verdict is invalidated if price falls below $111.22, which would break both moving averages that define the new uptrend.
This is technical analysis, not an investment recommendation. In plain terms, the chart says Paychex's recent rise still has the upper hand, and a clean push past $119.50 would be the next test.
Advertisement
Summary Data PAYX
Last price
117.06 USD
Change 1 day / 5 days / 1 month
-2.04% / 4.41% / 12.58%
Trend / MA-cross
uptrend / golden
SMA20 / SMA50
112.77 / 112.00
RSI (14) / Stochastic %K
58.6 / 64.7
Bollinger %B / ATR
75% / 3.89
Support / Resistance 20 days
104.64 / 119.50
Data as of
7 November 2026 04:00 WIB
Disclaimer: This technical analysis is generated automatically from exchange data and indicators calculated by JournalArta, for information and education only. The verdict and the entry, target and stop-loss levels are not investment advice or a solicitation to buy or sell any security. Investment decisions and their risks rest solely with the reader.