Thermo Fisher Scientific (TMO) Stock Rises 3.87% on Monday, Testing Key Resistance
Technical analysis of TMO stock on November 9, 2026: price 721.63 USD, trend uptrend, RSI 61.5, support 663.04, resistance 721.63.

Thermo Fisher Scientific closed Monday's November 9, 2026 NYSE session at $721.63, up 3.87% on the day from a prior close of $694.76. The gain extends a run of 5.71% over five days and 8.97% over one month, and it leaves the stock a hair below its three-month high of $723.08. Two further signals brought it to the top of today's list: the MACD histogram has just turned positive, and JournalArta has not covered the shares in 14 days.
Why TMO is in focus today
- Trading near its 3-month high (723.08)
- MACD histogram has just turned positive
- Uptrend confirmed (5-day change 5.71%)
- Not covered by JournalArta in the last 14 days
Selected automatically from 80 NYSE (US) stocks by a technical-signal score with daily weighted randomisation — not a recommendation.
Trend & Price Action
The structure is clean. The stock sits above both its 20-day average ($690.13) and its 50-day average ($662.80), and the 20-day line is above the 50-day, the textbook arrangement of an uptrend. The 20-day average itself rose 1.52% over five days, which says the advance is not a single-day spike but a steady lift in the average price paid over the past month. No new moving-average crossover has formed; the trend is established, not freshly signaled.
The three-month range runs from $580.00 to $723.08. Monday's close sits at the very top of the 20-day range, with support at $663.04 and resistance at $721.63. Put simply, the stock is trading at a ceiling it set itself.
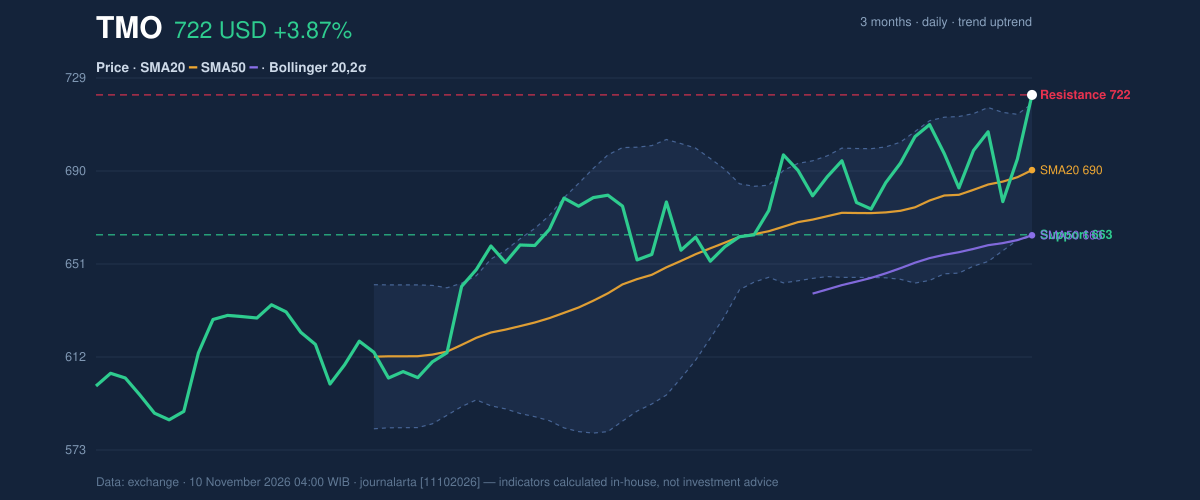
As the chart shows, price has pulled clear of the 20-day line and pressed through the upper Bollinger band. That matters. Bollinger bands mark two standard deviations around the 20-day average, a range that contains most trading. Thermo Fisher's upper band is at $717.92 and the close is above it, giving a %B reading of 107%. The band width is a normal 8.1%, so this is a breakout from a contracted range rather than an already stretched move.
Oscillators & Momentum
Momentum tells a more nuanced story. The RSI(14) is 61.5, classed as neutral: buyers are in control, but the reading is well short of the 70 threshold that usually flags an overheated stock. The Stochastic oscillator is more stretched, with %K at 97.7 and %D at 64.7. That gap shows how quickly the stock has climbed within its recent range, and an overbought Stochastic often precedes a pause.
The MACD stands at 11.006 against a signal line of 10.818, a histogram of 0.188. The margin is thin, but the histogram has just turned positive, so short-term momentum has swung back in the bulls' favor.
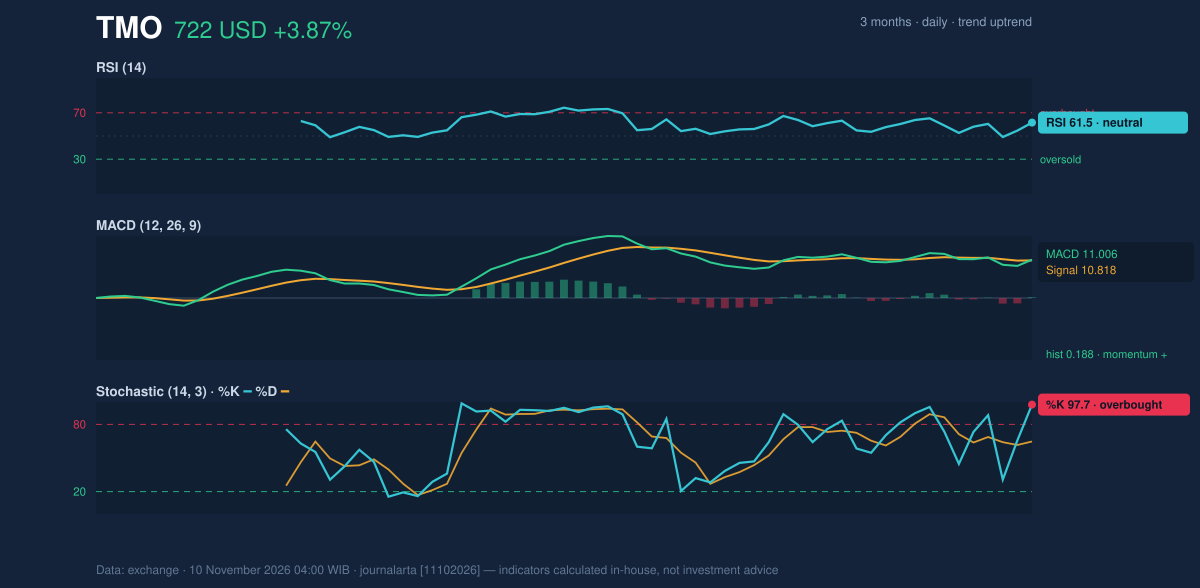
The mismatch between a calm RSI and a hot Stochastic is worth reading carefully. It points to a strong day inside a moderate trend, not an exhausted one.
Volatility & Volume
The 14-day Average True Range is $24.67, or 3.4% of the price, a moderate level of volatility. Practically, daily swings of roughly that size are normal for this stock now, so a pullback of one ATR would not by itself signal a change in direction.
Volume was subdued. Monday's 2,273,900 shares were 0.9 times the 20-day average of 2,431,525. A breakout on below-average volume carries less conviction than one on heavy turnover. Offsetting this, on-balance volume, which tallies volume on up days against down days, is rising, meaning the weight of trading has favored buyers over the period.
Fundamental Context
According to its SEC filing, Thermo Fisher reported quarterly revenue of $12.14 billion for the quarter ended September 26, up 9.1% from $11.12 billion a year earlier (Form 10-Q filed October 30). Net income was $1.72 billion versus $1.62 billion a year earlier, with diluted earnings per share of $4.64. On the same day the company filed a Form 8-K reporting a change of directors or officers.
Key Levels & Scenarios
If the stock holds above the upper band near $717.92 and the 20-day average at $690.13 keeps rising, the breakout stays intact. If it slips back inside the bands and below the $679.67 level, the move would look more like a failed push than a trend continuation. A close above the three-month high of $723.08 would put the stock in fresh territory for the period.
Technical Verdict: BUY
JournalArta's research model scores Thermo Fisher at +92 on a scale of −100 to +100, where +60 or above is a BUY. Four bullish technical signals are active and none are bearish.
- Trend structure: price is above the 50-day average and the 20-day average is above the 50-day, confirming an uptrend.
- Volatility breakout: a Bollinger squeeze resolved with a close above the upper band.
- Momentum and volume: the MACD histogram has just turned positive and rising OBV supports the advance.
Levels, valid until December 8, 2026:
- Entry range: $703.13 – $721.63
- Exit target 1: $784.57 (reward/risk 1.5)
- Exit target 2: $847.51 (reward/risk 3.0)
- Stop loss: $679.67
The verdict is invalidated if the price falls below $679.67. Risks to watch: the Stochastic at 97.7 is overbought, and volume ran below average.
In plain terms, the technical picture favors the upside, but this is chart analysis rather than investment advice, and a short pause after such a sharp rise would not be unusual.
Thermo Fisher's 8-K disclosing a change of directors or officers was filed on October 30, the same day as its quarterly report.
Summary Data TMO
| Last price | 721.63 USD |
| Change 1 day / 5 days / 1 month | 3.87% / 5.71% / 8.97% |
| Trend / MA-cross | uptrend / none |
| SMA20 / SMA50 | 690.13 / 662.80 |
| RSI (14) / Stochastic %K | 61.5 / 97.7 |
| Bollinger %B / ATR | 107% / 24.67 |
| Support / Resistance 20 days | 663.04 / 721.63 |
| Data as of | 10 November 2026 04:00 WIB |
| JournalArta research verdict (score) | Buy (+92) |
| Entry zone | 703.13 – 721.63 |
| Target 1 / 2 | 784.57 / 847.51 |
| Stop loss | 679.67 |
| Reward/risk | 1.5 / 3.0 |
Today's full Buy and Sell list for US stocks →
Disclaimer: This technical analysis is generated automatically from exchange data and indicators calculated by JournalArta, for information and education only. The verdict and the entry, target and stop-loss levels are not investment advice or a solicitation to buy or sell any security. Investment decisions and their risks rest solely with the reader.
Track TMO stock price daily: live levels, support/resistance and our full TMO analysis history.