McDonald’s (MCD) Stock Rises 1.78%, RSI Overbought In Focus
Technical analysis of MCD stock on November 9, 2026: price 281.44 USD, trend uptrend, RSI 76.0, support 235.81, resistance 281.44.

McDonald's shares closed at $281.44 on the New York Stock Exchange on Monday, November 9, 2026, up 1.78% from the previous close of $276.52 and sitting at the very top of their 20-day range. The stock has risen 5.95% over five days and 19.43% over one month, a run that has pushed it within a whisker of its three-month high of $283.26.
Why MCD is in focus today
- Trading near its 3-month high (283.26)
- Fresh golden cross: SMA20 crossed above SMA50
- RSI(14) at 76.0 — overbought zone
- Uptrend confirmed (5-day change 5.95%)
Selected automatically from 80 NYSE (US) stocks by a technical-signal score with daily weighted randomisation — not a recommendation.
Several signals line up behind the move. The shares are in an uptrend, a fresh golden cross has formed, and the price is pressing against the upper Bollinger Band. The same readings also show a stock that has run hard and fast.
Trend & Price Action
The trend structure is clean. The price sits well above both the 20-day simple moving average (SMA20) at $255.37 and the 50-day average (SMA50) at $249.10. The 20-day average itself rose 4.25% over five days, which tells us the climb is broad-based rather than a single-day spike.
A golden cross formed three sessions before the latest session, when the SMA20 crossed above the SMA50. Traders read this as a sign that recent prices are consistently higher than the longer-term norm. It is a lagging signal, though: it confirms a move already under way rather than predicting one.
Not new today. Three sessions old.
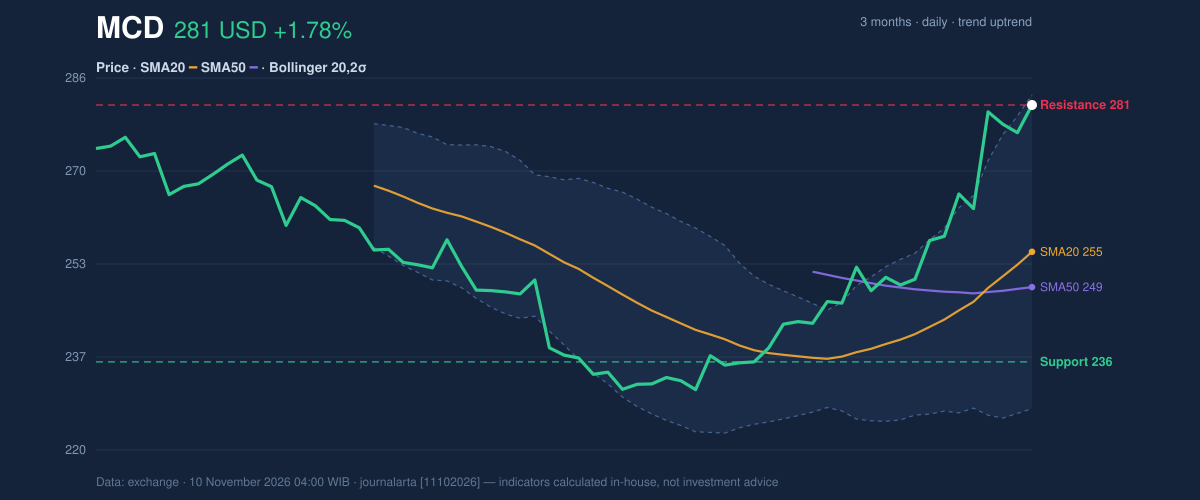
As the chart shows, the price has pulled well away from both averages. The 20-day support sits at $235.81 and the three-month low at $229.20, a long way below the current level. Resistance is the price itself: $281.44 is the 20-day high, and the three-month peak of $283.26 is only $1.82 away.
Oscillators & Momentum
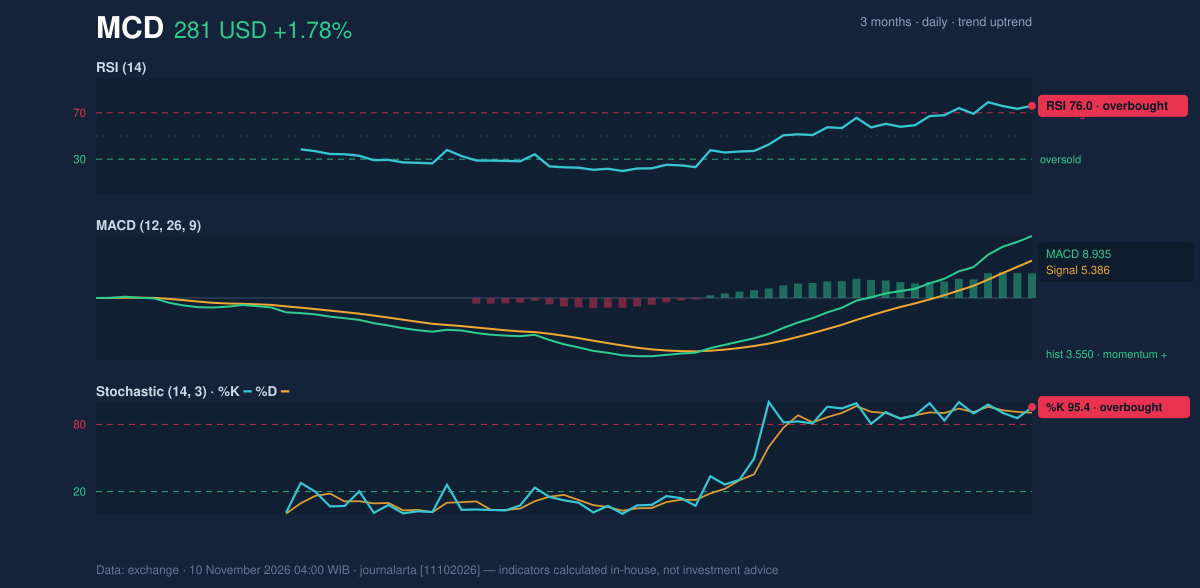
Momentum is strong but stretched. The 14-day Relative Strength Index (RSI) stands at 76.0, in overbought territory. The Stochastic oscillator is more extreme, with %K at 95.4 and %D at 90.4. Both gauge where the price sits relative to recent action; readings this high mean buyers have dominated for some time.
Overbought does not mean a reversal is due. In strong uptrends, these readings can persist for weeks. What they do signal is that the cushion for disappointment is thinner.
The MACD, which tracks the gap between short- and long-term momentum, reads 8.935 against a signal line of 5.386. The histogram of 3.550 is positive, so momentum is still expanding rather than fading. That keeps the oscillators from flashing a divergence warning.
Volatility & Volume
The Bollinger Bands (20 days, 2 standard deviations) span $227.49 to $283.24, with the middle line at $255.37. The price is at 97% of the band's width (%B), essentially hugging the upper edge. The band width has widened to 21.8%, a sign of high volatility, so the market is pricing in larger swings than a month ago.
The Average True Range (ATR), a measure of typical daily movement, is $6.73, or 2.4% of the price. That is moderate, and it frames how much room a normal session can take out of any level.
Volume offers a mixed message. Monday's turnover of 4,951,600 shares was 0.9 times the 20-day average of 5,703,880, slightly lighter than usual. A breakout toward a new high on below-average volume suggests less conviction than the price move implies. On the other hand, On-Balance Volume (OBV), which accumulates volume on up days and subtracts it on down days, is rising, so the broader pattern still shows buyers in control.
Fundamental Context
The rally follows the company's latest earnings. According to its SEC filing (Form 10-Q, filed November 6, 2026), McDonald's reported quarterly revenue of $7.16 billion for the quarter ended September 30, up 1.1% from $7.08 billion a year earlier. Net income was $2.49 billion, compared with $2.28 billion a year earlier, and diluted earnings per share were $3.51. The company also filed a Form 8-K on November 4 reporting its results of operations and financial condition.
Key Levels & Scenarios
The near-term map is simple. The three-month high of $283.26 and the upper Bollinger Band at $283.24 sit almost on top of each other, creating a tight ceiling. A sustained move through that zone would extend the trend; a failure to hold the recent gains would bring the entry area around $276 and then the $270 mark into play.
Technical Verdict: BUY
JournalArta's research model scores MCD at +66 on a scale of −100 to +100, above the +60 threshold for a BUY call. The strongest reasons:
- Golden cross: the SMA20 ($255.37) is above the SMA50 ($249.10), a fresh trend confirmation.
- Trend and volume: the price is in an uptrend above its 50-day average, and rising OBV supports it.
- Momentum: the MACD histogram at 3.550 is positive, with 2 bullish technical signals against 0 bearish.
The main risk is stretched conditions: RSI at 76.0 and Stochastic %K at 95.4 leave the stock vulnerable to a pullback.
- Entry range: $276.40 – $281.44
- Target 1: $298.60 (reward/risk 1.5)
- Target 2: $315.76 (reward/risk 3.0)
- Stop loss: $270.00
- Valid until: December 8, 2026
The verdict is invalidated if the price falls below $270.00.
This is technical analysis, not investment advice.
| Indicator | Value |
|---|---|
| Last price (Nov 9, 2026) | $281.44 |
| 1-day / 5-day / 1-month change | 1.78% / 5.95% / 19.43% |
| SMA20 / SMA50 | 255.37 / 249.10 |
| Bollinger upper / middle / lower | 283.24 / 255.37 / 227.49 |
| %B / band width | 97% / 21.8% |
| RSI(14) | 76.0 (overbought) |
| Stochastic %K / %D | 95.4 / 90.4 |
| MACD / signal / histogram | 8.935 / 5.386 / 3.550 |
| ATR(14) | 6.73 (2.4%) |
| Volume vs 20-day average | 4,951,600 vs 5,703,880 (0.9×) |
| 20-day support / resistance | 235.81 / 281.44 |
| 3-month low / high | 229.20 / 283.26 |
Summary Data MCD
| Last price | 281.44 USD |
| Change 1 day / 5 days / 1 month | 1.78% / 5.95% / 19.43% |
| Trend / MA-cross | uptrend / golden |
| SMA20 / SMA50 | 255.37 / 249.10 |
| RSI (14) / Stochastic %K | 76.0 / 95.4 |
| Bollinger %B / ATR | 97% / 6.73 |
| Support / Resistance 20 days | 235.81 / 281.44 |
| Data as of | 10 November 2026 04:00 WIB |
| JournalArta research verdict (score) | Buy (+66) |
| Entry zone | 276.40 – 281.44 |
| Target 1 / 2 | 298.60 / 315.76 |
| Stop loss | 270.00 |
| Reward/risk | 1.5 / 3.0 |
Today's full Buy and Sell list for US stocks →
Disclaimer: This technical analysis is generated automatically from exchange data and indicators calculated by JournalArta, for information and education only. The verdict and the entry, target and stop-loss levels are not investment advice or a solicitation to buy or sell any security. Investment decisions and their risks rest solely with the reader.
Track MCD stock price daily: live levels, support/resistance and our full MCD analysis history.