Salesforce (CRM) Stock Rises 0.60%, Testing Support Level In Focus
Technical analysis of CRM stock on November 9, 2026: price 214.94 USD, trend downtrend, RSI 35.2, support 213.65, resistance 250.29.
Salesforce shares closed at $214.94 on Monday, November 9, 2026, on the New York Stock Exchange, a 0.60% gain on the day that did little to repair the damage. The stock is down 4.97% over five days and 8.11% over one month. It sits just 4% of the way up its 20-day trading range, and the downtrend is the reason it made the watch list today.
Why CRM is in focus today
- Downtrend extending (5-day change -4.97%)
Selected automatically from 80 NYSE (US) stocks by a technical-signal score with daily weighted randomisation — not a recommendation.
Trend & Price Action
The structure is plainly bearish. The stock trades below its 20-day average of $235.20, which in turn sits below the 50-day average of $238.68. That ordering means recent buyers are underwater on average, and sellers have had the upper hand for weeks. No new moving-average crossover has formed, so the signal is a continuing slide, not a fresh break. The 20-day average itself is rolling over: it fell 0.85% over five days, a sign that the decline is dragging the trend line down with it.
The chart shows how far price has drifted from those averages. The 3-month range runs from $189.91 to $268.27, and the stock now sits in the lower portion of it.
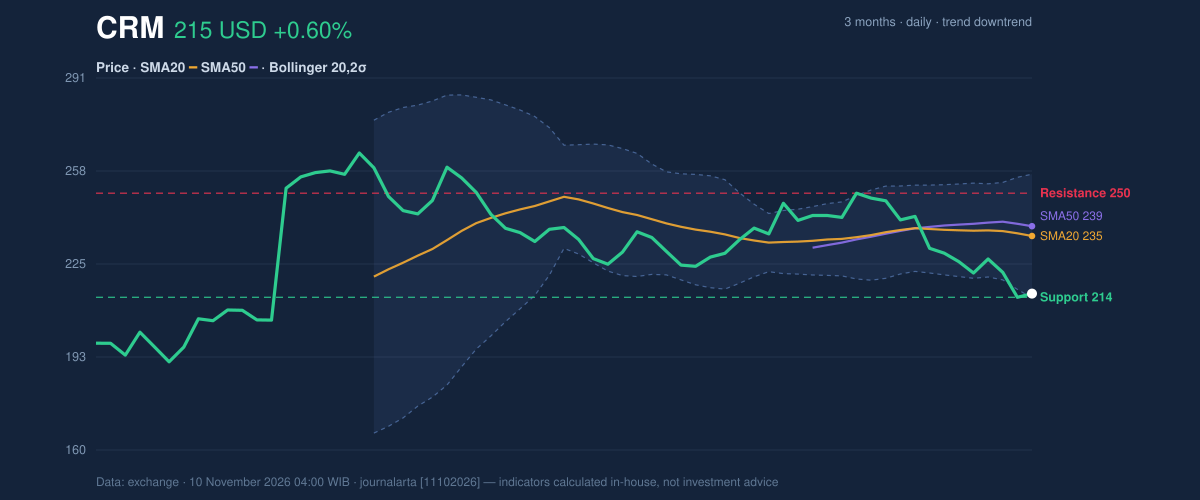
The nearest floor is the 20-day support at $213.65, which is also the previous close. Price is hovering just above it. Resistance at $250.29 is far overhead, and the 20-day average at $235.20 would likely be the first hurdle in any rebound.
Oscillators & Momentum
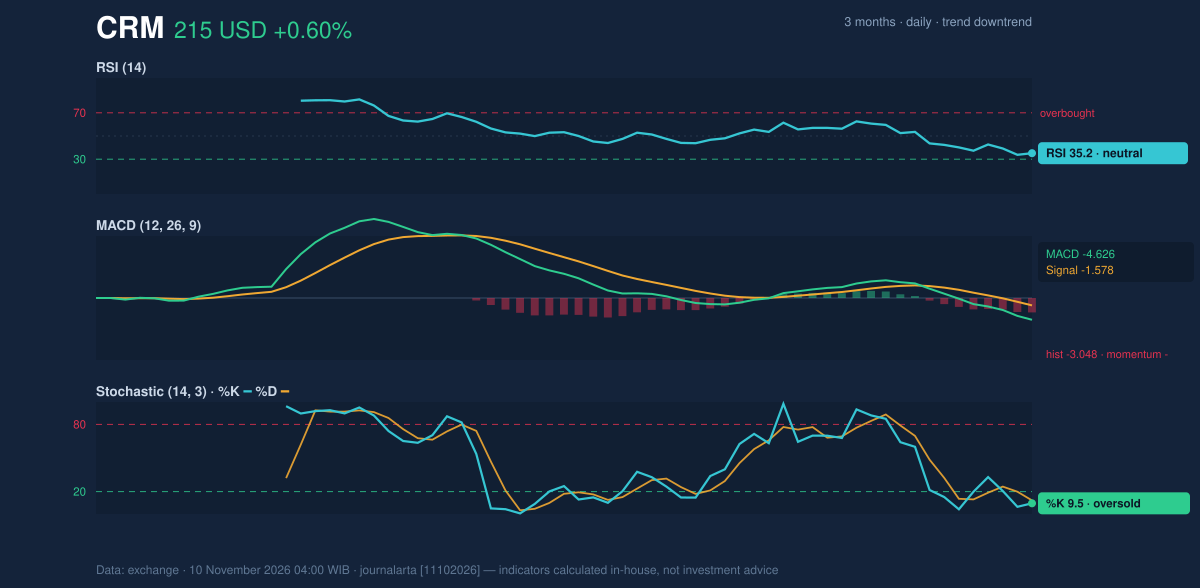
Momentum indicators disagree on how worried to be. The RSI(14) reads 35.2, which is neutral. The relative strength index compares recent gains with recent losses on a 0 to 100 scale; readings under 30 are usually called oversold. At 35.2 the stock is weak but not yet washed out. The code-computed signals note that RSI is rebounding from below 35, the single bullish mark against the bearish ones.
The Stochastic oscillator is more extreme: %K at 9.5 and %D at 12.1 both sit in oversold territory. Stochastics measure where the close falls within its recent range, so a reading near 10 says the stock is finishing near its lows. That can precede a bounce, but in a downtrend it can also stay pinned there for days.
The MACD is negative at -4.626, below its signal line of -1.578, with a histogram of -3.048. The widening gap means downside momentum is still building, not fading. As the momentum chart illustrates, the oversold stochastic and the deepening MACD point in different directions, which is why a relief rally and further decline both remain plausible.
Volatility & Volume
The stock is pressing against the bottom of its Bollinger Bands. Price is only 3% of the way from the lower band at $213.43 to the upper band at $256.97, a position known as %B. Band width is a normal 18.5%, so this is a drift down the band, not a volatility squeeze or blow-off.
Daily swings are still large. The 14-day average true range is $9.16, or 4.3% of the price, meaning a typical session can move the stock by roughly that much in either direction. Volume offers little conviction: Monday's 6,664,800 shares were 0.9 times the 20-day average of 7,266,390. Even so, on-balance volume is falling, so more volume has been going into down days than up days. The downtrend is confirmed by that flow, even without heavy selling on the latest session.
Fundamental Context
The selloff does not stem from a weak recent report. According to its SEC filing (Form 10-Q, filed August 27, 2026), Salesforce reported quarterly revenue of $11.35 billion for the quarter ended July 31, up 10.8% from $10.24 billion a year earlier. Net income was $3.53 billion, compared with $1.89 billion a year earlier, and diluted earnings per share were $4.29. The price action is therefore a market-sentiment story, not a reaction to deteriorating results.
Key Levels & Scenarios
Everything now hinges on the $213.65 to $213.43 zone, where the 20-day support and the lower Bollinger Band almost overlap. A close below it would open the path toward the lower targets below. A bounce from here would first have to clear the $221.80 area before the 20-day average comes into play, and the code-set stop sits at $230.51.
Technical Verdict: SELL
JournalArta's research model scores Salesforce at -60 on a scale of -100 to +100, the threshold for a SELL call. The strongest reasons:
- Trend structure: price is below the 50-day average, and the 20-day average sits below the 50-day, a classic downtrend alignment.
- Momentum: MACD at -4.626 is below its signal line, with a histogram of -3.048.
- Volume flow: falling on-balance volume confirms the downtrend, even though RSI at 35.2 has not reached oversold.
The oversold Stochastic (%K 9.5) is the main risk to this reading, since it can precede a short-term rebound.
- Entry range (sell zone): $214.94 – $221.80
- Exit target 1: $191.59 (reward/risk 1.5)
- Exit target 2: $168.23 (reward/risk 3.0)
- Stop loss: $230.51
The verdict is invalidated if price rises above $230.51. The levels are valid until December 8, 2026. This is technical analysis, not an investment recommendation, and the site disclaimer applies.
In plain terms: the chart says Salesforce is in a steady downtrend and the odds currently favor further weakness, unless it climbs back above $230.51.
The verdict levels are valid until December 8, 2026.
Summary Data CRM
| Last price | 214.94 USD |
| Change 1 day / 5 days / 1 month | 0.60% / -4.97% / -8.11% |
| Trend / MA-cross | downtrend / none |
| SMA20 / SMA50 | 235.20 / 238.68 |
| RSI (14) / Stochastic %K | 35.2 / 9.5 |
| Bollinger %B / ATR | 3% / 9.16 |
| Support / Resistance 20 days | 213.65 / 250.29 |
| Data as of | 10 November 2026 04:00 WIB |
| JournalArta research verdict (score) | Sell (-60) |
| Sell zone | 214.94 – 221.80 |
| Target 1 / 2 | 191.59 / 168.23 |
| Stop loss | 230.51 |
| Reward/risk | 1.5 / 3.0 |
Today's full Buy and Sell list for US stocks →
Disclaimer: This technical analysis is generated automatically from exchange data and indicators calculated by JournalArta, for information and education only. The verdict and the entry, target and stop-loss levels are not investment advice or a solicitation to buy or sell any security. Investment decisions and their risks rest solely with the reader.
Track CRM stock price daily: live levels, support/resistance and our full CRM analysis history.