Johnson & Johnson (JNJ) Stock Rises 2.13% on Monday, Testing Key Resistance
Technical analysis of JNJ stock on November 9, 2026: price 282.11 USD, trend sideways, RSI 63.6, support 248.61, resistance 282.11.

For investors watching US healthcare, J&J's latest session raises a simple question: is a stock that has just reached its 20-day high running on conviction or on momentum alone? Johnson & Johnson (NYSE: JNJ) closed Monday, November 9, 2026, at $282.11, up 2.13% on the day from a previous close of $276.22.
Why JNJ is in focus today
- Closed at a 20-day high (282.11)
- Trading near its 3-month high (282.73)
Selected automatically from 80 NYSE (US) stocks by a technical-signal score with daily weighted randomisation — not a recommendation.
That close matters. It is the highest in 20 trading days and sits just $0.62 below the 3-month high of $282.73. The gains are 4.27% over five days and 6.97% over one month.
Trend & Price Action
The stock now trades well above its 20-day simple moving average (SMA20) at $265.59. A moving average is just the mean closing price over a set window, so the gap shows how far the price has run ahead of its recent norm. The 50-day average is $266.07, slightly above the 20-day. That means the shorter average has not yet crossed above the longer one, and DATA shows no new crossover. In plain terms, the recent price surge has not yet changed the medium-term picture. The 20-day average itself rose 1.50% over five days, which is gentle, so the overall trend still reads sideways.
The chart below shows how far price has stretched from both averages and where it sits inside its Bollinger Bands.
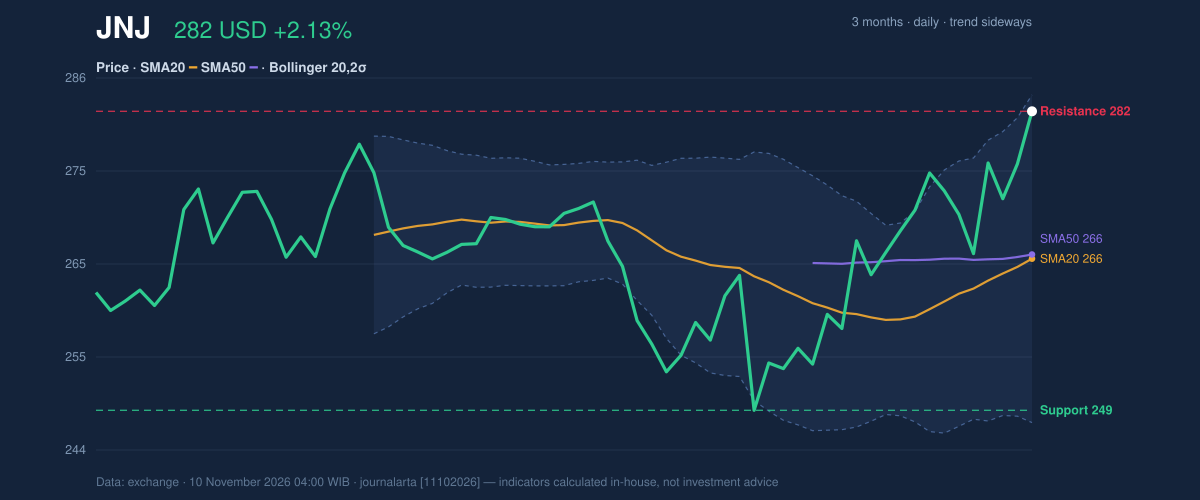
Bollinger Bands draw a channel two standard deviations around the 20-day average. The upper band is $283.95, the middle $265.59 and the lower $247.24. JNJ's %B reading is 95%, meaning the price sits near the very top of that channel. Band width is 13.8%, which is normal, so this is not a squeeze or a blow-off expansion. The stock is pressing against the ceiling of an ordinary range, and $283.95 is the next band edge above the close.
Oscillators & Momentum
Momentum indicators lean in the same direction but disagree on how stretched the move is. The 14-day RSI is 63.6, classed as neutral. The common overbought line is 70, so on this measure there is still room. The Stochastic oscillator, which compares the close with the recent high-low range, tells a hotter story: %K at 97.8 and %D at 81.6, both in overbought territory.
One reading says the rally has room to run. The other says it has already covered a lot of ground quickly. Stochastic readings this high usually mean the close landed at the extreme top of the recent range, which is exactly what happened here.
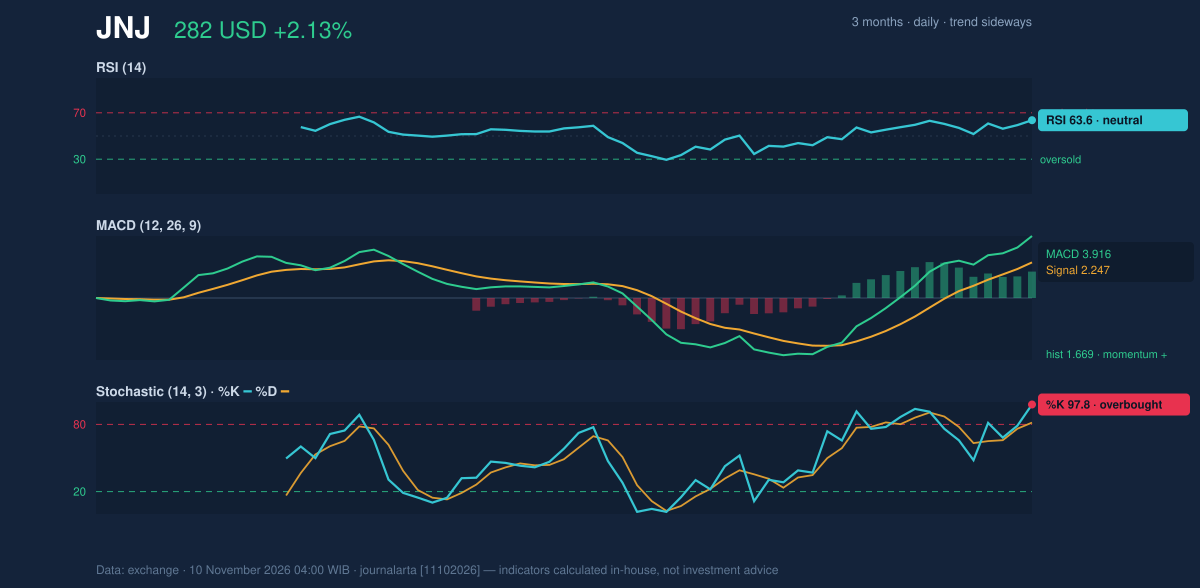
The MACD, which tracks the gap between short- and long-term momentum, offers confirmation. It stands at 3.916 against a signal line of 2.247, leaving a histogram of +1.669. A positive histogram means short-term momentum is outpacing its own recent average.
Volatility & Volume
The Average True Range (ATR) is 7.83, or 2.8% of the price. That is moderate volatility: JNJ is moving, but not wildly. Volume is the quieter part of the story. Monday's 6,899,500 shares were 0.8 times the 20-day average of 8,168,520. A move to a 20-day high on below-average trading suggests buyers did not need to be unusually aggressive, but also that the breakout has not yet drawn heavy participation. On-balance volume, which keeps a running tally of volume on up days versus down days, is rising, so the longer flow of money has still been tilting positive.
Fundamental Context
The official filings give a more mixed backdrop. According to its SEC filing (Form 10-Q, filed October 21, 2026), Johnson & Johnson reported quarterly revenue of $25.40 billion for the quarter ended September 27, 2026, up 5.9% from $23.99 billion a year earlier. Net income was $210.0 million, against $5.15 billion a year earlier, with diluted earnings per share of $0.09. Revenue growth and a steep drop in profit sit side by side. The filing excerpt does not explain the gap, so this article makes no claim about its cause.
Key Levels & Scenarios
The levels are clear. Resistance sits at $282.11 (20-day) and $282.73 (3-month high), essentially where the stock closed. Support is at $248.61 (20-day), with the 3-month low at $245.17. The ATR-based bands put the price minus 1.5 times ATR at $270.37 and the price plus 1.5 times ATR at $293.85.
Two conditional paths follow. If JNJ closes above the 20-day resistance, the first area above is $293.85. If it loses its footing, $270.37 is the first ATR-based marker, and a break below $248.61 would open the way to $245.17.
Technical Verdict: HOLD (wait & see)
JournalArta's research score for JNJ is +20 on a scale of −100 to +100, well short of the +60 threshold for a positive call and the −60 threshold for a negative one. The call is HOLD (wait & see), because trend and momentum are not yet aligned. The three strongest reasons:
- Averages not aligned: the price is above the 50-day average, but the 20-day average remains below it, with no new crossover.
- Stochastic overbought: %K at 97.8 shows the move is stretched even though RSI at 63.6 is neutral.
- Light volume: the high came on 0.8 times normal turnover, so participation has not confirmed it.
These are conditional scenarios, built only from the reference levels:
- Entry range (upside scenario): a close above the 20-day resistance of $282.11.
- Exit target: $293.85, the price plus 1.5 times ATR.
- Stop loss: $270.37, the price minus 1.5 times ATR.
- Downside scenario: a break of the 20-day support at $248.61, with $245.17, the 3-month low, as the next marker.
The verdict is invalidated if price breaks below $248.61, or if a close above $282.11 arrives with strong volume and the 20-day average crosses above the 50-day.
In plain English: J&J has run up fast to the top of its recent range, and the technical evidence does not yet say whether that move will last, so the sensible stance is to wait and watch.
This is technical analysis, not investment advice.
Summary Data JNJ
| Last price | 282.11 USD |
| Change 1 day / 5 days / 1 month | 2.13% / 4.27% / 6.97% |
| Trend / MA-cross | sideways / none |
| SMA20 / SMA50 | 265.59 / 266.07 |
| RSI (14) / Stochastic %K | 63.6 / 97.8 |
| Bollinger %B / ATR | 95% / 7.83 |
| Support / Resistance 20 days | 248.61 / 282.11 |
| Data as of | 10 November 2026 04:00 WIB |
| JournalArta research verdict (score) | Hold (+20) |
Today's full Buy and Sell list for US stocks →
Disclaimer: This technical analysis is generated automatically from exchange data and indicators calculated by JournalArta, for information and education only. The verdict and the entry, target and stop-loss levels are not investment advice or a solicitation to buy or sell any security. Investment decisions and their risks rest solely with the reader.
Track JNJ stock price daily: live levels, support/resistance and our full JNJ analysis history.