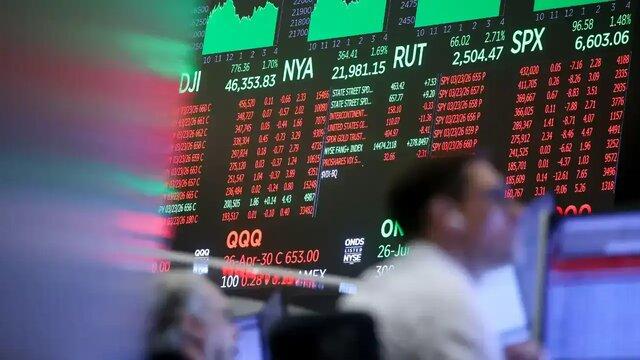
ORCL Stock Week Ahead: Levels and Scenarios for November 23–27
ORCL stock week ahead for November 23–27: last close 101.19 USD, weekly change -19.27%, support 101.19, resistance 144.54.
Last Week in Review
For international readers, the stakes are simple: Oracle has spent 2026 as a showcase for AI spending and a warning about what happens when expectations run ahead of the tape, and last week the warning won. The stock closed the week of November 16–20 at 101.19 USD, down 19.27% from 125.35 USD a week earlier — a collapse that erased roughly a fifth of the company's market value in five sessions and left the shares at the very bottom of their recent range.
The damage was broad and relentless. Oracle opened the week at 122.78, touched a high of only 123.14 on November 16, and then slid every single session — five down days out of five, not a single green close. The worst came on November 20, when the stock fell 8.48% to close at 101.19, just above the week's low of 100.25. The weekly range was a brutal 22.83%, and the close sat in the bottom 4% of that band. Even the "best" session, November 18, was a loss of 0.97%, which tells you how one-sided the selling was.
Volume offered some nuance. Average daily volume was 27.31 million shares versus a 20-session average of 41.93 million — 0.65x normal. Heavy selling on thinning volume can signal capitulation or simply exhausted liquidity; the final session, however, traded 47.3 million shares, about 1.1x normal, suggesting real conviction behind Friday's flush. For the month, the stock is down 19.79%, and year to date it has fallen 41%, against growth of 2.5% for the Computer and Technology sector and a 5.2% decline for Computer – Software, as reported on November 19.
Technical Map for the Week Ahead
Oracle is trading below every meaningful average. The 20-day simple moving average sits at 122.51 and the 50-day at 132.14, with price well beneath both — and the 20-day is itself below the 50-day and sloping down at -3.23% over five days. That is a textbook downtrend confirmation. The 20-day support is 101.19, exactly where the stock closed, while 20-day resistance stands far away at 144.54. The three-month high is 170.70 and the three-month low 100.25.
Momentum indicators are ugly but not yet a buy signal. RSI(14) is 31.9 — neutral on the data label, but knocking on oversold territory. Stochastic is genuinely oversold at %K 3.1 / %D 9.1. MACD reads -6.290 against a signal line of -4.851, with the histogram at -1.439: momentum remains negative and widening. Bollinger Bands (20, 2σ) span from 141.85 at the top to 103.16 at the bottom around a 122.51 midline. The critical detail: %B is -5%, meaning price has closed below the lower band, and the band width has expanded to 31.6% — high volatility with a downside break. ATR(14) is 8.06, or 8.0% of the price, which frames just how violent daily swings have become.
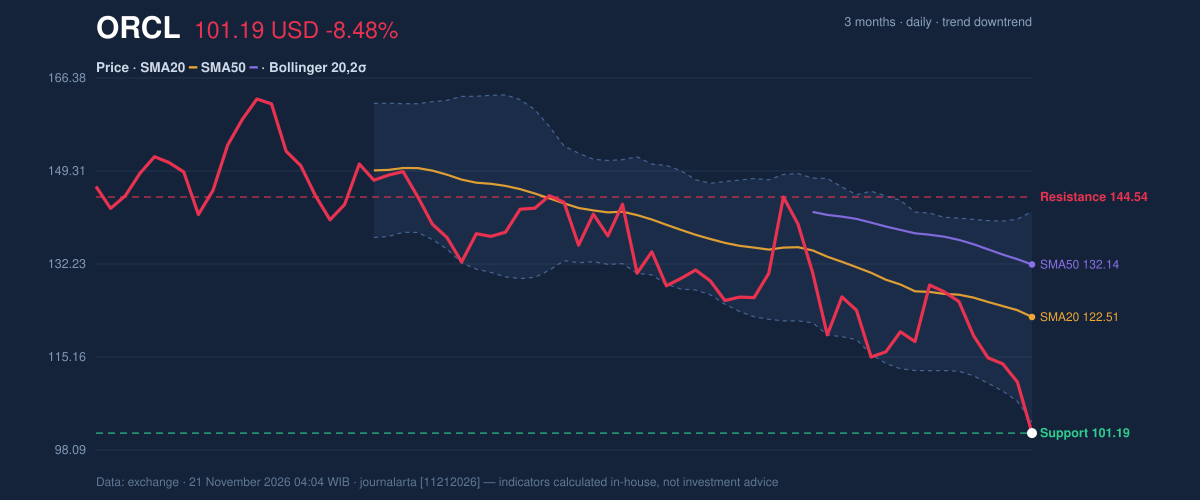
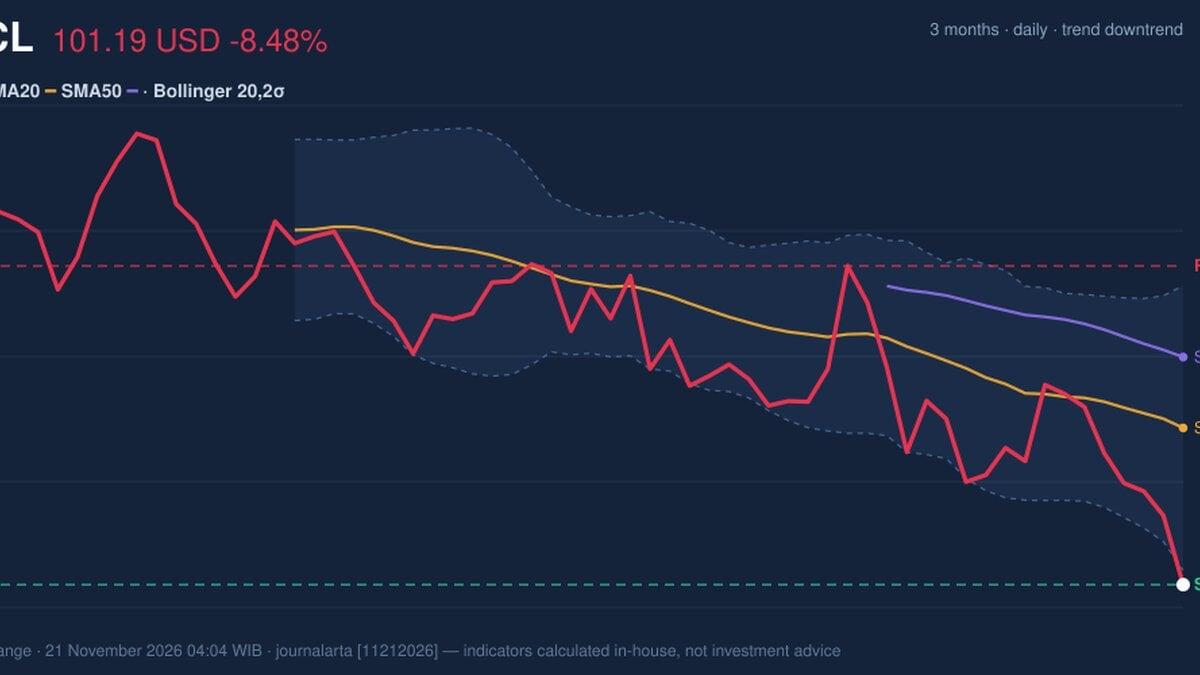
The price chart shows a near-vertical decline into the 100–101 zone, with the lower Bollinger band now trailing above the close. 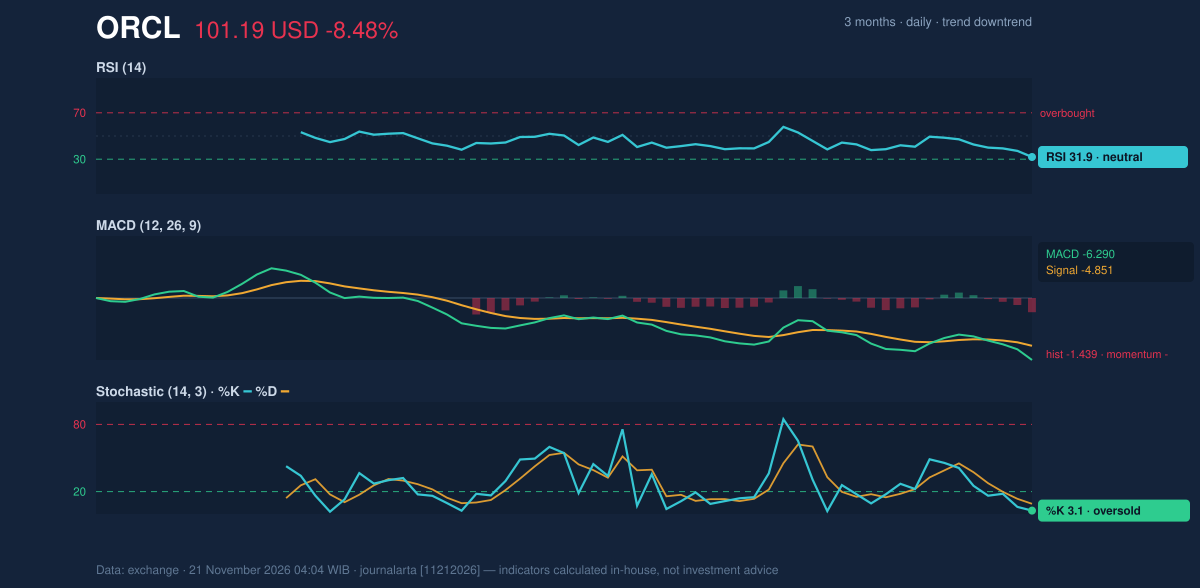
The momentum panel shows RSI pinned near 32 and the MACD histogram still deepening below zero, with OBV falling — volume is confirming the downtrend rather than diverging from it.
Bullish scenario: a stabilization, ideally a close back above the lower Bollinger band at 103.16 and then the 20-day resistance at 144.54, would signal the selling is exhausting itself and open the path toward the 20-day SMA at 122.51. The trigger is a close above 144.54.
Bearish scenario: if the stock slips below the 20-day support at 101.19 and then the three-month low of 100.25, the downtrend extends with no nearby technical floor; a 1.5x-ATR move below spot points to 89.09.
Fundamentals and Catalysts
The disconnect between Oracle's operating results and its share price is the central puzzle. For the quarter ended August 31, 2026, Oracle reported revenue of $19.35 billion, up 29.6% from $14.93 billion a year earlier, according to its Form 10-Q filed on September 11. Net income was $4.76 billion versus $2.93 billion a year prior, with diluted earnings per share of $1.56. A later read, published November 19, put first-quarter fiscal 2027 revenue growth at 30% year over year to $19.35 billion, with non-GAAP EPS up 30% to $1.92. Those are strong growth numbers for a legacy software and cloud company.
Yet the shares have underperformed badly, falling 41% year to date against sector growth, as reported November 19. On November 20, Oracle filed a Form 8-K with the U.S. Securities and Exchange Commission reporting the results of a shareholder vote — a governance item rather than an operating one, but a filing that keeps the corporate calendar in view for readers tracking disclosure flow.
Macro, Political and Global Factors
The macro backdrop is not helping richly valued technology names. Federal Reserve Governor Waller said on November 10 that he would support a 25 basis point increase in the FOMC's policy rate at the December meeting even if October inflation improves — a signal that the rate path may stay restrictive.
Two global threads matter for Oracle specifically. Waller noted on November 10 that high-tech goods prices tied to the AI buildout continue to rise at a very high rate in recent months — a cost pressure that sits inside the very infrastructure cycle Oracle is leaning into. Separately, Governor Bowman said on November 10 that geopolitical tensions could keep energy prices elevated and raise the risk that core inflation stays high through pass-through to consumer prices. Higher-for-longer rates compress the present value of long-duration growth stories; that is context, not a forecast for the shares.
Risks and What Would Invalidate the Scenario
The downside scenario is invalidated if price closes back above the 20-day resistance at 144.54, with an intermediate hurdle at the Bollinger lower band of 103.16 and the 20-day SMA at 122.51. The bullish scenario is invalidated by a break below the 20-day support at 101.19 and the three-month low of 100.25.
Technical Verdict for the Week: HOLD (wait & see)
The tape argues for patience rather than conviction in either direction. Price is stretched far below the 20-day SMA at 122.51 and the 50-day at 132.14, RSI at 31.9 sits in the 30–50 zone, and Stochastic at 3.1 is deeply oversold — conditions where sharp counter-trend bounces are common. But the MACD at -6.290 with a widening negative histogram and a falling OBV confirm the downtrend's integrity, and the 101.19 support is barely holding. The stop would sit too far from price to justify a directional call.
- Entry Range: conditional — consider only on a close above 20-day resistance at 144.54 (upside scenario), or on a breakdown below 20-day support at 101.19 (downside scenario)
- Target Price: upside target 20-day SMA 122.51; downside reference 89.09 (price − 1.5×ATR)
- Stop Loss: 100.25 (three-month low) for the upside scenario; 113.29 (price + 1.5×ATR) for the downside scenario
In plain English: Oracle is oversold enough to bounce but still trapped in a confirmed downtrend, so the disciplined stance is to wait for the market to pick a side before acting.
The next scheduled event is the opening of the November 23–27 trading week on Monday, November 23.
ORCL Week Ahead Data
| Trading week | November 16 – November 20 (5 sessions) |
| Weekly change | -19.27% (125.35 → 101.19 USD) |
| Week high / low | 123.14 (November 16) / 100.25 (November 20) |
| Best / worst session | -0.97% (November 18) / -8.48% (November 20) |
| Avg daily volume vs prior 20 sessions | 27,310,180 vs 41,925,710 (0.65x) |
| SMA20 / SMA50 | 122.51 / 132.14 |
| RSI (14) / Stochastic %K | 31.9 / 3.1 |
| Support / Resistance 20 days | 101.19 / 144.54 |
| 3-month high / low | 170.70 / 100.25 |
| Week covered | November 23–27, 2026 |
| Data as of | 21 November 2026 04:04 WIB |
| JournalArta research verdict (score) | Hold (-68) |
Today's full Buy and Sell list for US stocks →
Disclaimer: This technical analysis is generated automatically from exchange data and indicators calculated by JournalArta, for information and education only. The verdict and the entry, target and stop-loss levels are not investment advice or a solicitation to buy or sell any security. Investment decisions and their risks rest solely with the reader.
Track ORCL stock price daily: live levels, support/resistance and our full ORCL analysis history.
 Take the quizWhat Kind of Holiday Spender Are You? Take the Black Friday QuizStart →
- 1Stock Market Today: Dow Slides 1.34% and VIX Jumps 15% at Midday

- 2Joachim Klement to Sell Stocks After S&P 500 Signal

- 3Stock Market Today: Nasdaq, S&P 500 Futures Slide as AI Selloff Deepens
- 4Kenneth Walker’s Groin Injury Puts Cardinals Game in Doubt

- 5Pat Cummins Faces Captaincy Doubts From Mitchell Johnson

 Lifestyle · Food & HealthNormal Blood Pressure Chart by Age: Healthy Ranges Explained
 Lifestyle · Food & HealthWhat Is Raynaud’s Syndrome? Why Fingers Turn White in the Cold
 Lifestyle · Food & Health4 Ways Walking After Meals Helps Your Body, Doctors Say
 Lifestyle · Food & Health4 Reasons to Eat Oatmeal, According to Nutrition Experts