Uber Stock Update: Slides 4.60%, Down 5.1% in Five Sessions
Technical analysis of UBER stock on November 19, 2026: price 65.60 USD, trend sideways, RSI 38.8, support 65.25, resistance 71.17.

Why UBER is in focus today
- One-day move of 0.00%, about 0.0× its average daily range (ATR)
Selected automatically from 11 NYSE (US) stocks by a technical-signal score with daily weighted randomisation — not a recommendation.
Trend & Price Action
The trend picture is unambiguously defensive. Uber trades below its 20-day average of $67.96 and below its 50-day average of $69.13, and the 20-day average itself is drifting lower, falling 0.23% over the past five sessions. No fresh moving-average cross has formed, but the existing configuration — shorter average under longer average, price under both — is the classic signature of a market that has stopped rewarding buyers. The 20-day average sitting beneath the 50-day is one of the two bearish signals flagged in the JournalArta computation. The three-month range tells the same story from a different angle: a high of $82.36 against a low of $64.04. At $65.60, the stock is trading close to that low, having surrendered most of the ground gained during the period. For readers new to the vocabulary, a support level is simply a price where buyers have previously stepped in; $65.25 is the nearest such shelf, and the session's close is sitting almost directly on top of it.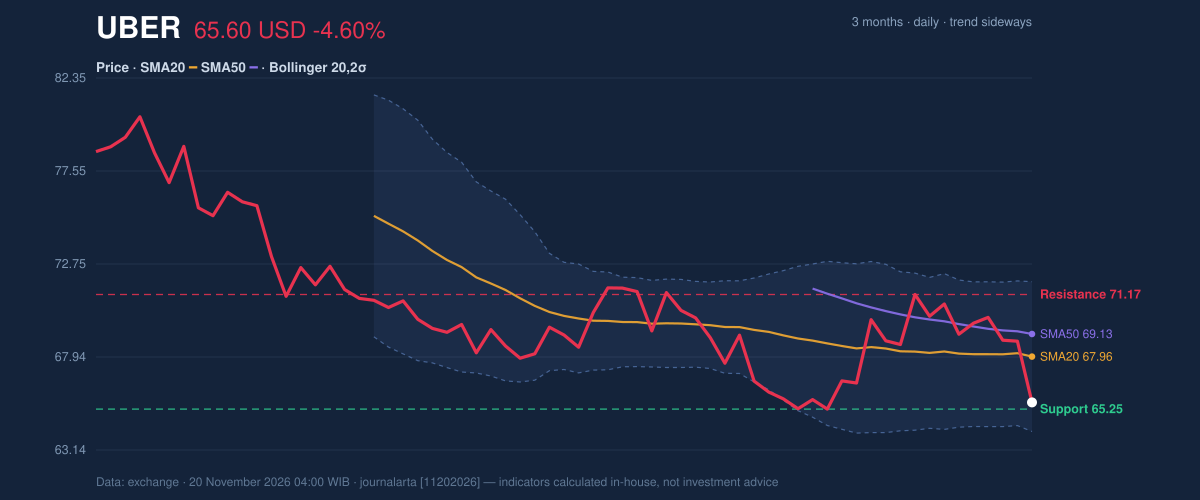
Oscillators & Momentum
Momentum indicators are split, and the split matters. The 14-day Relative Strength Index reads 38.8 — neutral territory, not yet oversold, which means the decline has room to extend before it triggers the kind of exhaustion that typically precedes a bounce. RSI in the 30-to-50 band is the footprint of a market losing strength without having capitulated. Stochastic tells a more dramatic story. The %K line at 3.8 against a %D of 37.5 is deeply oversold, a reading that would normally hint at a short-term snapback. The divergence between a stretched Stochastic and a merely neutral RSI is the technical version of a coiled spring that has not yet been released: short-term selling pressure is extreme, but the broader momentum gauge has not confirmed a reversal. The MACD removes most of the ambiguity. At -0.249 against a signal line of -0.199, the histogram has just turned negative at -0.050 — the second bearish signal in the JournalArta tally. A negative histogram means the downward momentum is accelerating, not merely persisting, and that is hard to reconcile with a durable turn higher.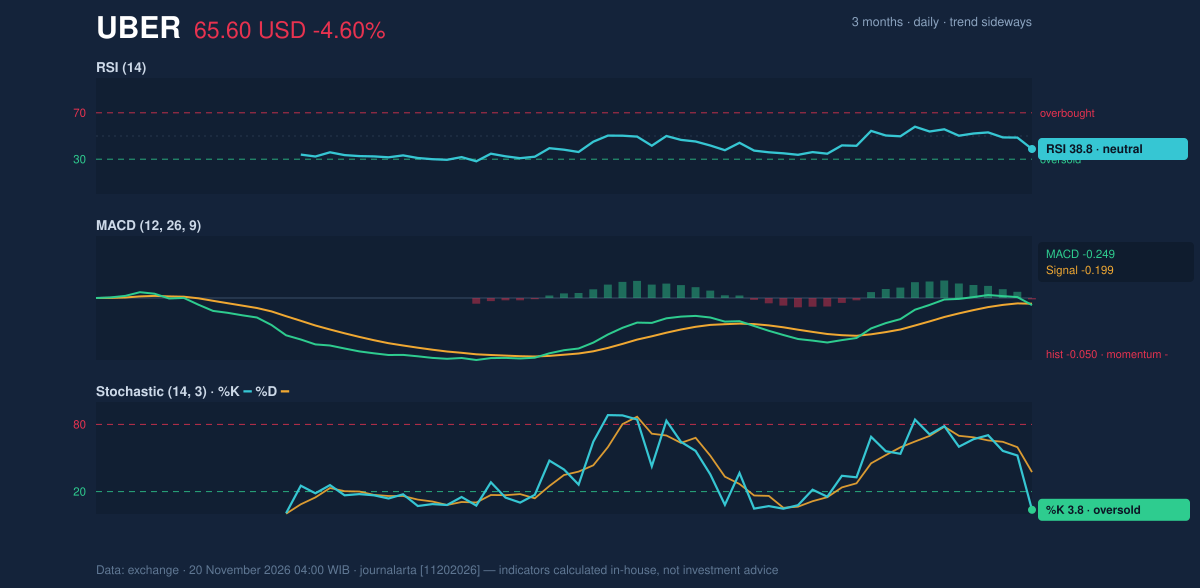
Volatility & Volume
The Bollinger setup deserves attention. The bands span $64.10 at the lower edge to $71.83 at the upper, with the middle line at $67.96 and a band width of 11.4% — normal, neither compressed nor blown out. The %B reading of 19% places the close in the bottom fifth of the band, near the lower rail. In plain terms, the stock has been pushed toward the edge of its recent statistical envelope, and the lower band at $64.10 is the next reference point if $65.25 fails. Average True Range of 2.51, equal to 3.8% of the share price, marks volatility as high; a two-standard-deviation daily swing is a routine event here, not an anomaly. The confirmation from volume flow is the most telling piece: with the stock down and turnover running at 1.5 times normal, the On-Balance Volume line is falling. OBV is a running tally that adds volume on up days and subtracts it on down days; its decline means sellers, not buyers, are the ones showing up in size.Key Levels & Scenarios
The immediate decision point is $65.25. A close below it would put the $64.10 lower Bollinger band and then the three-month low of $64.04 in play — levels that sit within a single day's average range. On the other side, any recovery must first reclaim the $67.96 20-day average, then the $69.13 50-day line, before the $71.17 20-day resistance becomes the operative test. The JournalArta computation defines a sell zone of $65.60 to $67.48, targets at $56.48 and $47.36, and a stop above at $71.68, valid until December 18, 2026, with a reward-to-risk profile of 1.5 to 3.0. Fundamental context does not override the chart. Uber reported quarterly revenue of $14.77 billion for the quarter ended September 30, 2026, up 9.6% from $13.47 billion a year earlier, according to its SEC filing; net income came in at $512.0 million, against $6.63 billion a year earlier in a period that included a large one-off gain, with diluted earnings per share of $0.25. Growth in the top line has not been enough to arrest the technical deterioration.Technical Verdict: SELL
Three factors underpin the call. First, price sits below both the 20-day and 50-day averages, with the 20-day average itself declining. Second, the MACD histogram has just flipped negative, signalling accelerating downside momentum. Third, the falling OBV on volume 1.5 times normal shows distribution rather than accumulation. - Sell zone (entry): $65.60 – $67.48 - Target 1: $56.48 - Target 2: $47.36 - Stop loss: $71.68 The verdict is invalidated if price breaks and holds above the stop at $71.68, which would place the stock back above both moving averages and neutralise the bearish configuration. For a general reader, the technical picture says the sellers currently hold the initiative and the burden of proof has shifted to the buyers.Summary Data UBER
| Last price | 65.60 USD |
| Change 1 day / 5 days / 1 month | -4.60% / -5.09% / -5.02% |
| Trend / MA-cross | sideways / none |
| SMA20 / SMA50 | 67.96 / 69.13 |
| RSI (14) / Stochastic %K | 38.8 / 3.8 |
| Bollinger %B / ATR | 19% / 2.51 |
| Support / Resistance 20 days | 65.25 / 71.17 |
| Data as of | 20 November 2026 04:00 WIB |
| JournalArta research verdict (score) | Sell (-66) |
| Sell zone | 65.60 – 67.48 |
| Target 1 / 2 | 56.48 / 47.36 |
| Stop loss | 71.68 |
| Reward/risk | 1.5 / 3.0 |
Disclaimer: This technical analysis is generated automatically from exchange data and indicators calculated by JournalArta, for information and education only. The verdict and the entry, target and stop-loss levels are not investment advice or a solicitation to buy or sell any security. Investment decisions and their risks rest solely with the reader.
Track UBER stock price daily: live levels, support/resistance and our full UBER analysis history.
 Take the quizWhat Kind of Holiday Spender Are You? Take the Black Friday QuizStart →
Most Read





Don't Miss
 Lifestyle · Food & HealthNormal Blood Pressure Chart by Age: Healthy Ranges Explained
 Lifestyle · Food & HealthWhat Is Raynaud’s Syndrome? Why Fingers Turn White in the Cold
 Lifestyle · Food & Health4 Ways Walking After Meals Helps Your Body, Doctors Say
 Lifestyle · Food & Health4 Reasons to Eat Oatmeal, According to Nutrition Experts