Applied Materials (AMAT) Stock Update: Slides 3.80%, Down 11% in Five Sessions
Technical analysis of AMAT stock on November 19, 2026: price 338.93 USD, trend downtrend, RSI 36.7, support 319.25, resistance 421.66.

Why AMAT is in focus today
- One-day move of 0.00%, about 0.0× its average daily range (ATR)
Selected automatically from 11 NASDAQ (US) stocks by a technical-signal score with daily weighted randomisation — not a recommendation.
Trend & Price Action
The structural picture is unambiguously bearish. At $338.93, the stock trades below both its 20-day average of $372.33 and its 50-day average of $428.72, and no fresh moving-average cross has formed — the market is simply repricing lower inside an established decline. The 20-day average itself fell 3.26% over the past five sessions, which tells you the short-term trend line is still bending downward rather than flattening out. The spread between the two averages — the 20-day well beneath the 50-day — is the classic signature of a downtrend that has not yet exhausted itself. On the day itself, the tape was quiet in proportion: the session range was roughly 0.0× the average daily true range, meaning the 3.8% decline was delivered with relatively little intraday excursion. That is often how grinding declines behave — sellers do not need to force the issue when buyers are absent.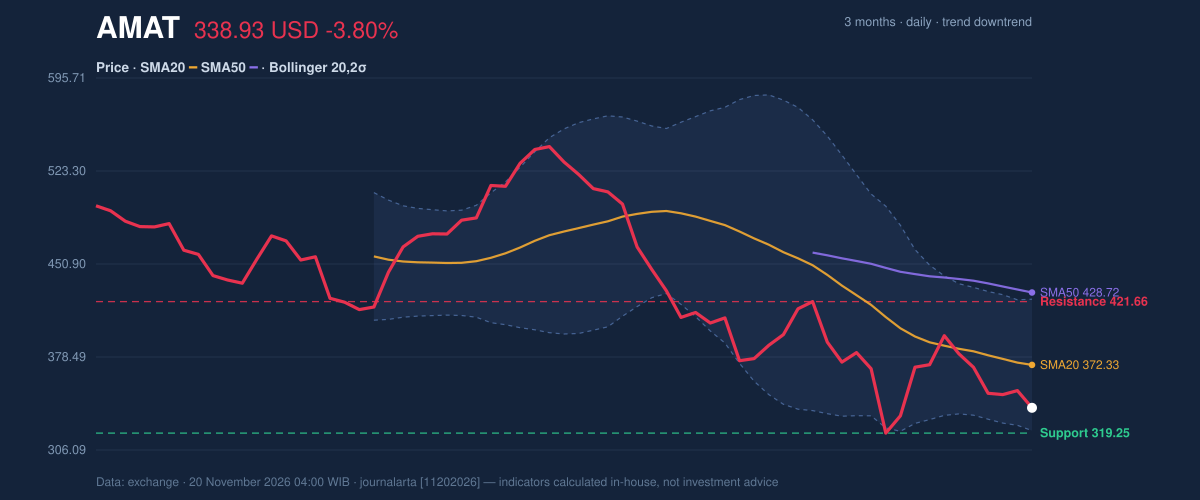
Oscillators & Momentum
Momentum offers the only counterweight, and it is faint. The 14-day RSI at 36.7 sits in the neutral 30–50 zone — weak, but not yet oversold. Stochastic readings of %K 25.0 against %D 31.5 are similarly neutral, with %K below %D, meaning the short-term oscillator is still pointing down. Neither gauge is offering the kind of capitulation reading that typically precedes a durable bottom.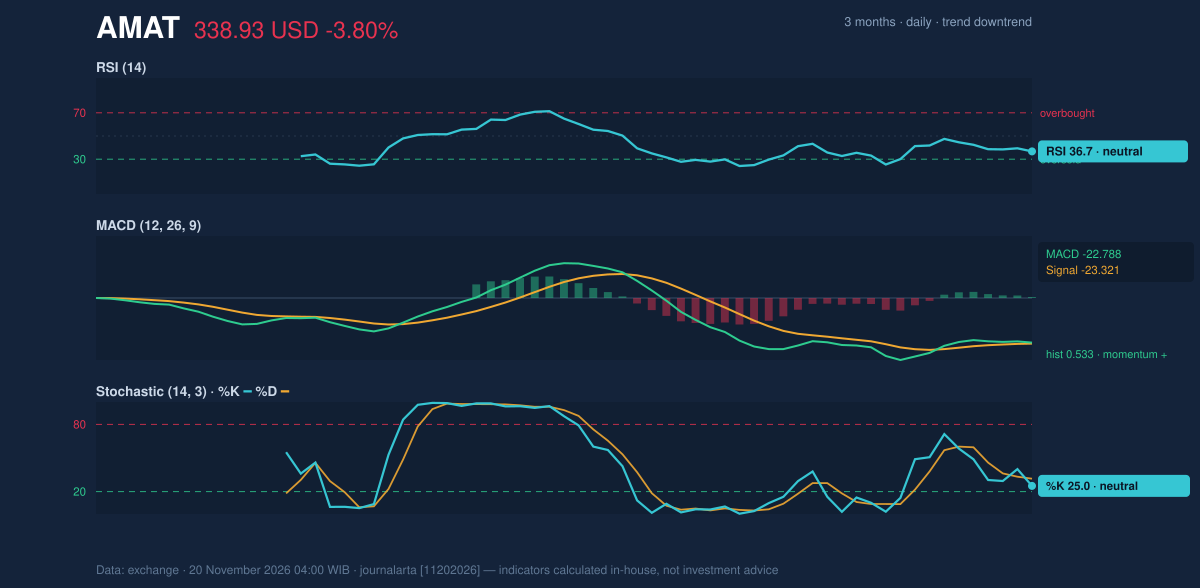
Volume, Volatility & the Technical Scoreboard
Participation tells its own story. Last session's volume of 7.17 million shares ran at just 0.9× the 20-day average, and on-balance volume is falling. Thin volume on a down day is ambiguous — it can mean exhausted sellers or simply absent buyers — but falling OBV confirms that the cumulative weight of trading is still shifting to the sell side. The code-computed signal set reflects this: zero bullish signals against two bearish ones, the latter being a bounce into the 20-day average within a downtrend and a downtrend confirmed by falling OBV. Volatility is the practical constraint. Average true range of $26.64 equals 7.9% of the share price, which means a normal day's swing is roughly 27 dollars. Any stop placed at a conventional distance would sit too far from the current quote to make sense on a risk-adjusted basis — the reason the verdict remains on hold rather than either side of the trade.Fundamental Context
The operating numbers do not explain the selling. According to its SEC filing, Applied Materials reported quarterly revenue of $9.12 billion for the quarter ended July 26, 2026, up 24.8% from $7.30 billion a year earlier, with net income of $2.54 billion and diluted earnings per share of $3.17. The company filed a Form 8-K on November 12, 2026 reporting its results of operations and financial condition. In other words, the equity is de-rating against a backdrop of strong reported demand — a gap that usually reflects expectations about the next cycle rather than the last one.Key Levels & Scenarios
Two thresholds frame the next move. On the downside, $319.25 is the 20-day support, with the three-month low at $316.95 just beneath it — a cluster that makes the $317–$319 zone the line in the sand. A decisive close below it would open the measured-extension area around $298.97, the level 1.5 times ATR beneath the current price. On the upside, $421.66 is the 20-day resistance, and a close above that would be the first evidence that the bounce into the 20-day average has become something more than a reflex. Between those poles, the stock is a coin toss inside a downtrend.Technical Verdict: HOLD (wait & see)
The call is HOLD (wait & see), and the reasoning is disciplined rather than indecisive. Price sits below its 50-day average, the 20-day average sits below the 50-day, and the slope is still negative — a textbook downtrend. RSI at 36.7 and a five-day loss of 11.03% put the stock in the weak half of its range without any oversold trigger. And with ATR at 7.9% of price, the stop needed to protect a position would sit too far from $338.93 to be defensible. The verdict is invalidated if price closes decisively above $421.66 or breaks $319.25. - Upside scenario entry: a close above the 20-day resistance at $421.66, with the 20-day average itself as the first objective. - Upside target: $421.66 to $423.51, the resistance and upper Bollinger band converging in the same zone. - Downside scenario trigger: a break of $319.25; measured downside reference at $298.97. - Stop protection: $298.97 on the downside scenario, $316.95 as the hard floor behind the three-month low. In plain English: the stock is falling inside a well-defined downtrend, the most recent session's loss was not enough to make it cheap, and the sensible posture is to wait for the market to declare itself at one of the two edges of the range. "You don't step in front of a 7.9% daily range just because the revenue line still looks good," one desk analyst said. "You wait for the tape to pick a side."Summary Data AMAT
| Last price | 338.93 USD |
| Change 1 day / 5 days / 1 month | -3.80% / -11.03% / -9.76% |
| Trend / MA-cross | downtrend / none |
| SMA20 / SMA50 | 372.33 / 428.72 |
| RSI (14) / Stochastic %K | 36.7 / 25.0 |
| Bollinger %B / ATR | 17% / 26.64 |
| Support / Resistance 20 days | 319.25 / 421.66 |
| Data as of | 20 November 2026 04:00 WIB |
| JournalArta research verdict (score) | Hold (-76) |
Today's full Buy and Sell list for US stocks →
Disclaimer: This technical analysis is generated automatically from exchange data and indicators calculated by JournalArta, for information and education only. The verdict and the entry, target and stop-loss levels are not investment advice or a solicitation to buy or sell any security. Investment decisions and their risks rest solely with the reader.
Track AMAT stock price daily: live levels, support/resistance and our full AMAT analysis history.
 Take the quizWhat Kind of Holiday Spender Are You? Take the Black Friday QuizStart →





 Lifestyle · Food & HealthNormal Blood Pressure Chart by Age: Healthy Ranges Explained
 Lifestyle · Food & HealthWhat Is Raynaud’s Syndrome? Why Fingers Turn White in the Cold
 Lifestyle · Food & Health4 Ways Walking After Meals Helps Your Body, Doctors Say
 Lifestyle · Food & Health4 Reasons to Eat Oatmeal, According to Nutrition Experts