DexCom (DXCM) Stock Slides 2.82% on Thursday, Down 1.5% in Five Sessions
Technical analysis of DXCM stock on November 19, 2026: price 80.19 USD, trend downtrend, RSI 44.8, support 77.94, resistance 88.48.
Why DXCM is in focus today
- One-day move of 0.00%, about 0.0× its average daily range (ATR)
Selected automatically from 11 NASDAQ (US) stocks by a technical-signal score with daily weighted randomisation — not a recommendation.
The Trend Is Still Down
The structural picture is unambiguous. DexCom sits below its 20-day average of 81.42 USD and well below its 50-day average of 84.01 USD, and the 20-day average itself is sloping lower. No new moving-average cross formed in the latest session, so the existing bearish alignment — shorter average under longer average — remains intact rather than freshly triggered. The stock is parked at just 21% of its 20-session range, which runs from support at 77.94 USD to resistance at 88.48 USD. Its three-month band of 76.52 USD to 92.59 USD frames the wider context: the price is closer to the floor than the ceiling, and a bounce toward the 20-day average would still be a bounce within a downtrend, not a trend change. As the chart shows, each rally attempt since the recent high has run into that moving average and faded.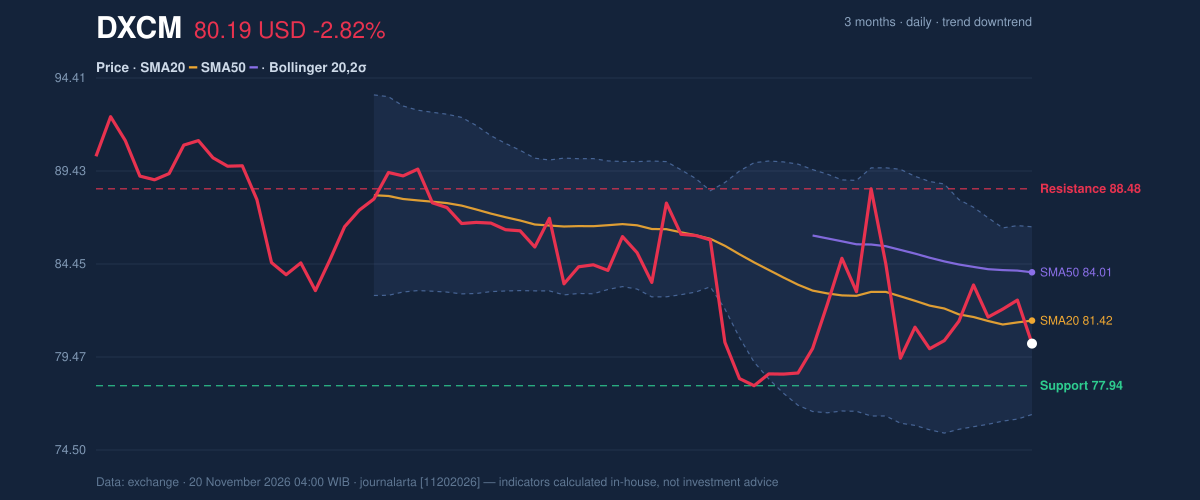
Momentum Is Splitting
RSI(14) at 44.8 is neutral in the literal sense — neither oversold nor overbought — but it sits in the 30-to-50 zone that typically describes a market lacking buying pressure. The more interesting divergence is in the faster oscillators: Stochastic %K has fallen to 11.1 against %D at 24.1, deep in oversold territory. That combination — fast stochastic exhausted, RSI merely middling — usually signals a market that has sold off quickly within a larger downtrend rather than one building a base. The MACD histogram is positive at 0.109, with the MACD line at -0.663 above its signal at -0.772, which is genuine short-term improvement. But improvement below the zero line is a slowing decline, not an upturn in trend. The chart shows this tension directly: momentum is stabilising while price keeps leaking.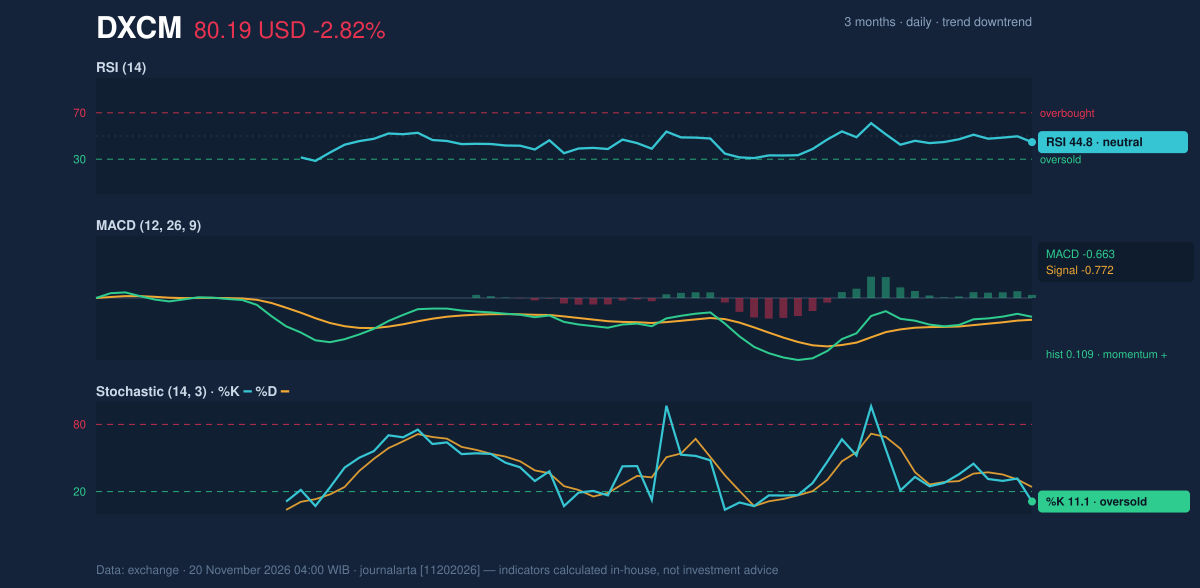
Volatility & Volume
ATR(14) of 3.22 USD equals about 4.0% of the share price — high volatility, meaning a single session can move the stock materially in either direction. Bollinger bands are of normal width at 12.3%, spanning 76.40 USD to 86.44 USD, with %B at 38%: the price sits in the lower half of the envelope, closer to the lower band than the upper. Volume offered little confirmation. The latest session traded 4.47 million shares, about 1.0× the 20-day average of 4.69 million, which is ordinary participation — no capitulation, no accumulation. Yet On-Balance Volume is rising, a supportive divergence suggesting sellers are not dominating the tape despite the lower close.Fundamental Context
The company's operations look steadier than its chart. According to its SEC filing, DexCom reported quarterly revenue of $1.34 billion for the quarter ended September 30, 2026, up 11.2% from $1.21 billion a year earlier (Form 10-Q filed October 29, 2026). Net income was $275.1 million versus $283.8 million a year prior, with diluted earnings per share of $0.72 — growth at the top line, modest compression at the bottom. The market is pricing something other than the revenue trend.Key Levels & Scenarios
The immediate reference is the 20-day average at 81.42 USD: a close back above it would ease the immediate pressure and put the 84.01 USD 50-day average in play. Below, support at 77.94 USD is the first test; a break there would expose the three-month low at 76.52 USD. A hold and reclaim of the Bollinger midline would be the first constructive sign, while failure at support keeps the downtrend intact.Technical Verdict: SELL
The call is SELL, driven by three signals that reinforce each other. First, price trades below its 50-day average while the 20-day average sits below the 50-day — a bearish stack. Second, the 20-day average is declining, confirming trend rather than noise. Third, RSI at 44.8 places momentum in the weak 30-to-50 zone, and the lone technical signal on the bearish side is a bounce into the 20-day average within a downtrend. The positive MACD histogram and rising OBV are real, but they argue for a pause, not a reversal. - Sell zone: 80.19 – 82.60 USD - Target 1: 71.99 USD - Target 2: 63.78 USD - Stop loss: 85.66 USD - Reward/risk: 1.5 / 3.0 | valid until December 18, 2026 The verdict is invalidated if price closes above the stop at 85.66 USD. In plain terms: the trend, the moving averages and the momentum gauge all point the same way, and one improving momentum reading is not enough to change that. DexCom's 52-week high of 92.59 USD was set within the last three months, and the shares are now 13.4% below it.Summary Data DXCM
| Last price | 80.19 USD |
| Change 1 day / 5 days / 1 month | -2.82% / -1.47% / 2.39% |
| Trend / MA-cross | downtrend / none |
| SMA20 / SMA50 | 81.42 / 84.01 |
| RSI (14) / Stochastic %K | 44.8 / 11.1 |
| Bollinger %B / ATR | 38% / 3.22 |
| Support / Resistance 20 days | 77.94 / 88.48 |
| Data as of | 20 November 2026 04:00 WIB |
| JournalArta research verdict (score) | Sell (-68) |
| Sell zone | 80.19 – 82.60 |
| Target 1 / 2 | 71.99 / 63.78 |
| Stop loss | 85.66 |
| Reward/risk | 1.5 / 3.0 |
Disclaimer: This technical analysis is generated automatically from exchange data and indicators calculated by JournalArta, for information and education only. The verdict and the entry, target and stop-loss levels are not investment advice or a solicitation to buy or sell any security. Investment decisions and their risks rest solely with the reader.
Track DXCM stock price daily: live levels, support/resistance and our full DXCM analysis history.
 Take the quizWhat Kind of Holiday Spender Are You? Take the Black Friday QuizStart →
Most Read





Don't Miss
 Lifestyle · Food & HealthNormal Blood Pressure Chart by Age: Healthy Ranges Explained
 Lifestyle · Food & HealthWhat Is Raynaud’s Syndrome? Why Fingers Turn White in the Cold
 Lifestyle · Food & Health4 Ways Walking After Meals Helps Your Body, Doctors Say
 Lifestyle · Food & Health4 Reasons to Eat Oatmeal, According to Nutrition Experts