Adobe (ADBE) Stock Falls 2.00% (November 19, 2026): Down 18.1% in a Month
Technical analysis of ADBE stock on November 19, 2026: price 221.68 USD, trend downtrend, RSI 32.8, support 221.68, resistance 263.82.

Why ADBE is in focus today
- One-day move of 0.00%, about 0.0× its average daily range (ATR)
Selected automatically from 11 NASDAQ (US) stocks by a technical-signal score with daily weighted randomisation — not a recommendation.
Trend & Price Action: Below Both Averages, and Falling
The structural picture is unambiguously weak. The 20-day average sits at 243.67 and the 50-day average at 244.43, both well above the closing price, and the 20-day average itself fell 2.05% over the past five days — meaning the trend line is chasing the price downward rather than the price bouncing off it. The death cross, formed on the latest session, confirms that short-term momentum has undercut the medium-term trend. In plain terms: the people buying over the past month have been, on average, losing money on the trade.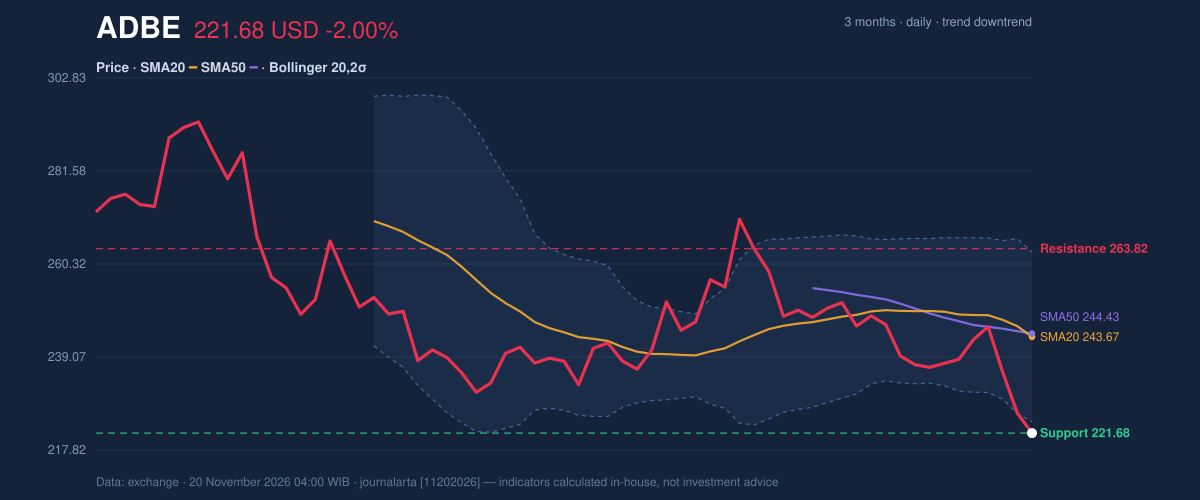
Oscillators & Momentum: Oversold, but Not Reversing
The momentum cluster is where the story gets interesting, because the indicators are sending two different messages about the same stock. The RSI(14) reads 32.8, which the data classifies as neutral — not yet in the classic oversold territory below 30. The Stochastic, however, is deeply oversold at %K 5.1 against %D 7.8, and the MACD is negative at -4.975 against a signal line of -2.887, with the histogram at -2.088.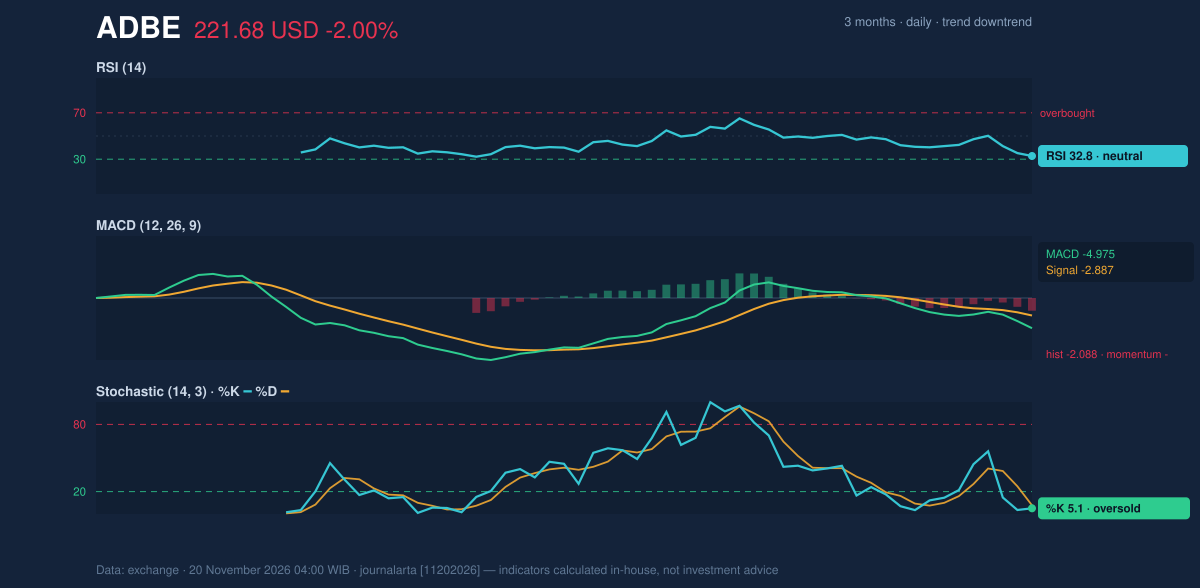
Volatility & Volume: A Quiet Market in a Loud Downtrend
The volatility reading deserves attention. ATR(14) is 8.31, or 3.7% of the price — high volatility by any normal standard — which means daily swings of roughly that magnitude are now routine. That cuts both ways: it makes the sell zone more credible as a place where price can keep sliding, and it makes any stop-loss placement uncomfortably wide. Volume tells the less flattering story. The last session's 3,563,900 shares came in at just 0.9× the 20-day average of 3,855,115, and on-balance volume is declining. A decline on normal-to-thin volume is not panic selling; it is an absence of buyers. The selection signal for the day — a 1-day move of 0.00% against approximately 0.0× the average daily range — points to a session that was compressed relative to the stock's own recent restlessness, which in a downtrend can signal indecision ahead of the next leg rather than a floor.Key Levels & Scenarios
The levels are straightforward. Support rests at 221.68, effectively identical to the close, with the three-month low at 219.80 as the real line in the sand. Resistance stands at 263.82, nearly a fifth above current levels and marked by the middle Bollinger band at 243.67. If price breaks and holds below 219.80, the structure offers little in the way of a natural floor and the next meaningful references sit in the low-to-mid 200s. If the stock instead reclaims the lower band at 224.28 and pushes toward the 20-day average of 243.67, the immediate selling pressure would be neutralised — but the death cross and the negative MACD histogram would still argue that any rebound is a repair rally, not a trend change. Fundamental context does not rescue the chart. According to its SEC filing, Adobe reported quarterly revenue of $6.76 billion for the quarter ended August 28, 2026, up 12.9% from $5.99 billion a year earlier, with net income of $1.83 billion and diluted earnings per share of $4.62. Growth is intact — the market's problem, on this chart, is what it is willing to pay for that growth.Technical Verdict: SELL
SELL — the JournalArta research verdict scores -76 on a scale running from -100 to +100, with a sell trigger at -60 or below. Three drivers carry the call: price trades below its 50-day average; the 20-day average has crossed below the 50-day, a fresh death cross; and on-balance volume is falling, confirming distribution rather than accumulation. The scorecard reads 0 bullish signals against 2 bearish ones. The invalidation condition is defined: the call fails if price breaks and holds above 235.82, the stop level that sits above the sell zone and near the region where the averages begin to converge.- Entry (sell zone): 221.68 – 227.91
- Exit / Target 1: 200.47
- Exit / Target 2: 179.26
- Stop Loss: 235.82
- Reward/risk: 1.5 / 3.0 — valid until 18 December 2026
Summary Data ADBE
| Last price | 221.68 USD |
| Change 1 day / 5 days / 1 month | -2.00% / -7.07% / -18.06% |
| Trend / MA-cross | downtrend / death |
| SMA20 / SMA50 | 243.67 / 244.43 |
| RSI (14) / Stochastic %K | 32.8 / 5.1 |
| Bollinger %B / ATR | -7% / 8.31 |
| Support / Resistance 20 days | 221.68 / 263.82 |
| Data as of | 20 November 2026 04:00 WIB |
| JournalArta research verdict (score) | Sell (-76) |
| Sell zone | 221.68 – 227.91 |
| Target 1 / 2 | 200.47 / 179.26 |
| Stop loss | 235.82 |
| Reward/risk | 1.5 / 3.0 |
Today's full Buy and Sell list for US stocks →
Disclaimer: This technical analysis is generated automatically from exchange data and indicators calculated by JournalArta, for information and education only. The verdict and the entry, target and stop-loss levels are not investment advice or a solicitation to buy or sell any security. Investment decisions and their risks rest solely with the reader.
Track ADBE stock price daily: live levels, support/resistance and our full ADBE analysis history.
 Take the quizWhat Kind of Holiday Spender Are You? Take the Black Friday QuizStart →





 Lifestyle · Food & HealthNormal Blood Pressure Chart by Age: Healthy Ranges Explained
 Lifestyle · Food & HealthWhat Is Raynaud’s Syndrome? Why Fingers Turn White in the Cold
 Lifestyle · Food & Health4 Ways Walking After Meals Helps Your Body, Doctors Say
 Lifestyle · Food & Health4 Reasons to Eat Oatmeal, According to Nutrition Experts