Stocks
MarketsThe latest on Stocks from our Markets desk.
Live prices & market news: Markets overview · Stocks · Crypto · Forex · Commodities
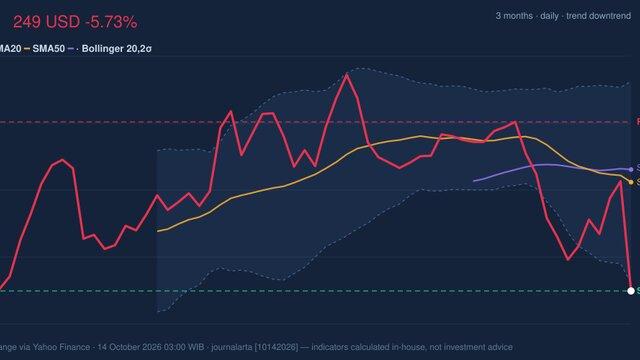
JNJ Stock Drops 5.73%, Death Cross Pressure In Focus
On October 13, 2026: price 248.61 USD, trend downtrend, RSI 34.4, support 248.61, resistance 271.95. technical analysis of jnj stock.
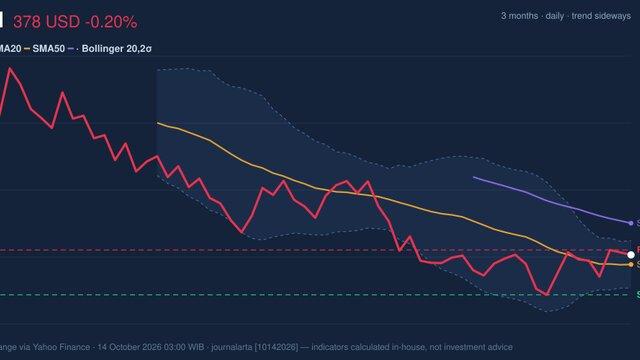
Testing Key Resistance, UNH Stock Drops 0.20% on Tuesday
On October 13, 2026: price 377.76 USD, trend sideways, RSI 47.8, support 365.20, resistance 379.30. technical analysis of unh stock.
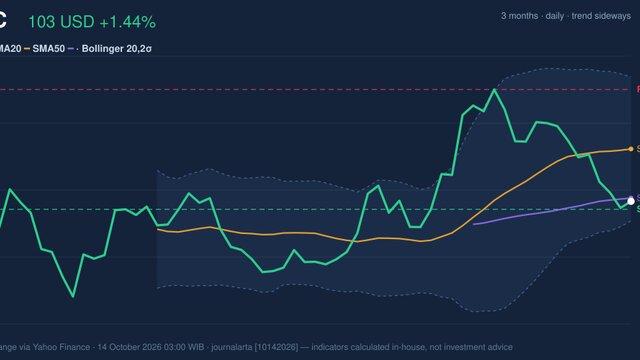
INTC Stock Gains 1.44%, Momentum Weakens In Focus
On October 13, 2026: price 102.81 USD, trend sideways, RSI 42.1, support 101.05, resistance 127.39. technical analysis of intc stock.
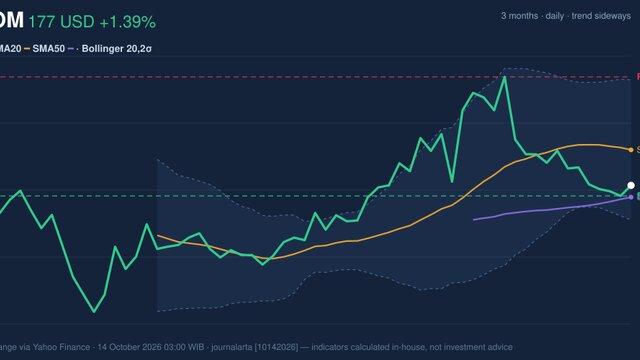
QCOM Stock Gains 1.39%, Testing Support Level In Focus
On October 13, 2026: price 176.86 USD, trend sideways, RSI 46.3, support 174.43, resistance 201.97. technical analysis of qcom stock.
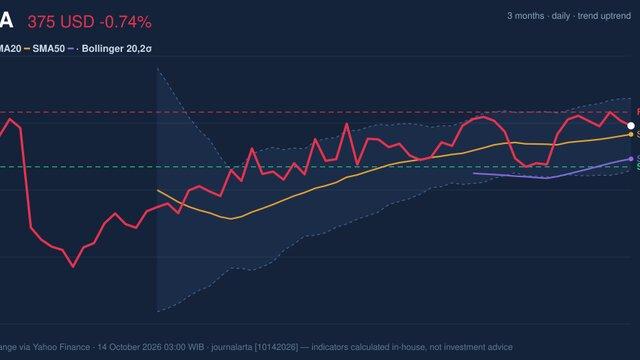
TSLA Momentum Gains: Stock Drops 0.74% (October 13, 2026)
On October 13, 2026: price 375.23 USD, trend uptrend, RSI 54.0, support 352.84, resistance 382.70. technical analysis of tsla stock.
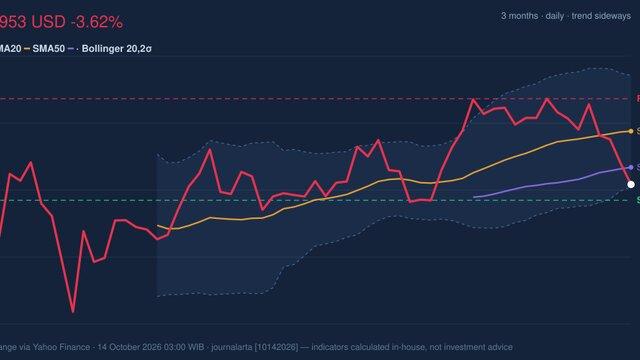
Momentum Weakens, MU Stock Drops 3.62% on Tuesday
On October 13, 2026: price 953.19 USD, trend sideways, RSI 40.1, support 926.55, resistance 1,097.39. technical analysis of mu stock.
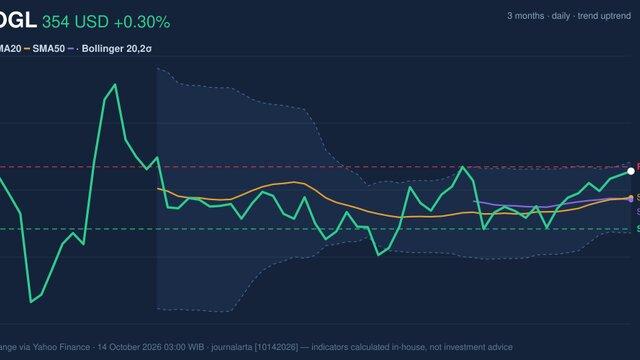
GOOGL Stock Technicals: Gains 0.30% on Tuesday, Golden Cross Formed
On October 13, 2026: price 353.78 USD, trend uptrend, RSI 57.8, support 337.83, resistance 354.97. technical analysis of googl stock.
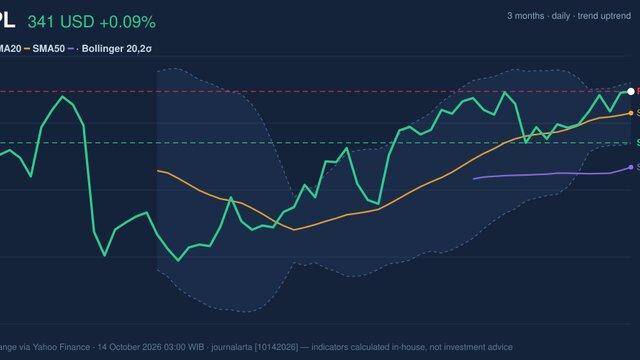
Testing Key Resistance, AAPL Stock Gains 0.09% on Tuesday
On October 13, 2026: price 341.27 USD, trend uptrend, RSI 60.6, support 329.40, resistance 341.27. technical analysis of aapl stock.

Stock Market Dow S&P Slip as Chip Stocks Weigh on Wall Street
U.S. stocks closed lower Tuesday as losses in semiconductor shares and mixed bank earnings weighed on major indexes. The Dow fell 0.4%, while the S&P 500 ended near flat and the Nasdaq Composite lost 0.4%. Investors now turn to September inflation data and another round of bank earnings.
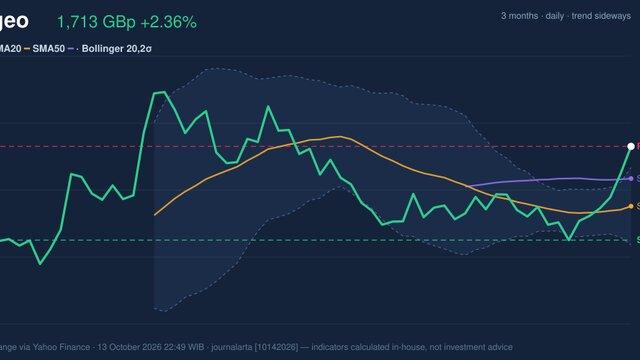
Diageo Testing Key Resistance: Stock Gains 2.36% (October 13, 2026)
On October 13, 2026: price 1,712.50 GBp, trend sideways, RSI 64.7, support 1,575.50, resistance 1,712.50. technical analysis of diageo stock.
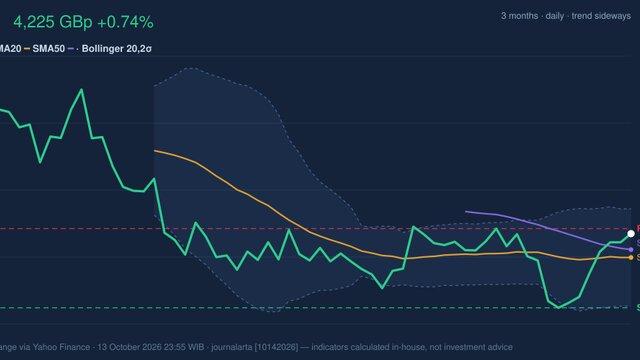
BAT Stock Technicals: Gains 0.74% on Tuesday, Testing Key Resistance
On October 13, 2026: price 4,225.00 GBp, trend sideways, RSI 57.0, support 3,960.00, resistance 4,243.00. technical analysis of bat stock.
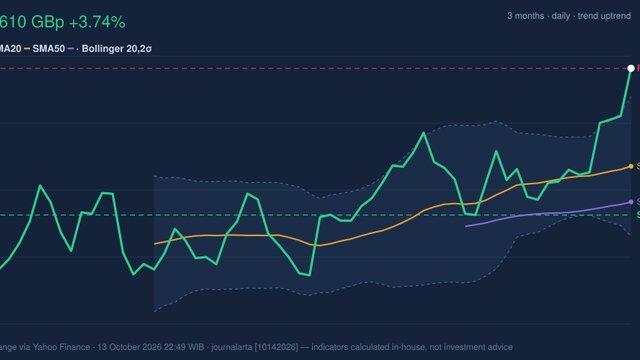
RSI Overbought, BP Stock Gains 3.74% on Tuesday
On October 13, 2026: price 610.00 GBp, trend uptrend, RSI 72.5, support 542.30, resistance 610.00. technical analysis of bp stock.
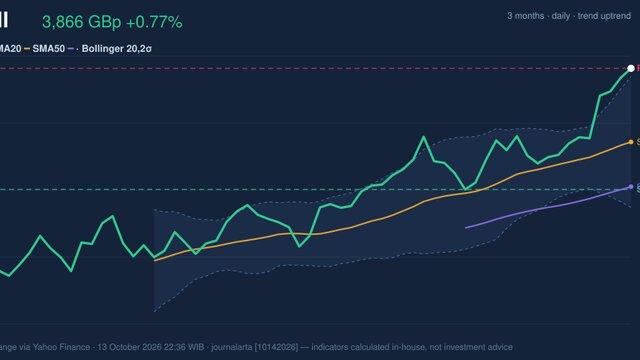
Shell RSI Overbought: Stock Gains 0.77% (October 13, 2026)
On October 13, 2026: price 3,865.50 GBp, trend uptrend, RSI 76.0, support 3,488.50, resistance 3,865.50. technical analysis of shell stock.
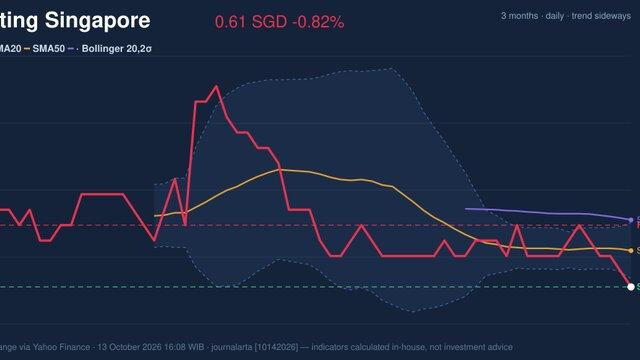
Genting Singapore Stock Drops 0.82% on Tuesday, Testing Support Level
On October 13, 2026: price 0.61 SGD, trend sideways, RSI 36.1, support 0.61, resistance 0.63. technical analysis of genting singapore stock.
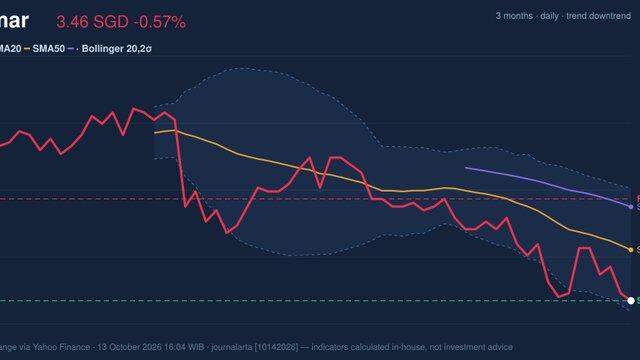
Wilmar Stock Analysis: Drops 0.57%, Testing Support Level
On October 13, 2026: price 3.46 SGD, trend downtrend, RSI 34.7, support 3.46, resistance 3.73. technical analysis of wilmar stock.
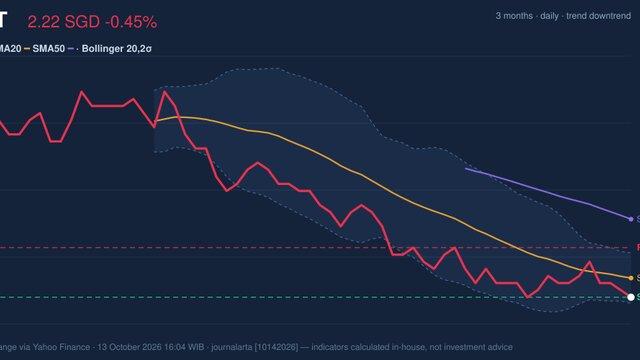
CICT Stock Drops 0.45%, Testing Support Level In Focus
On October 13, 2026: price 2.22 SGD, trend downtrend, RSI 35.8, support 2.22, resistance 2.29. technical analysis of cict stock.
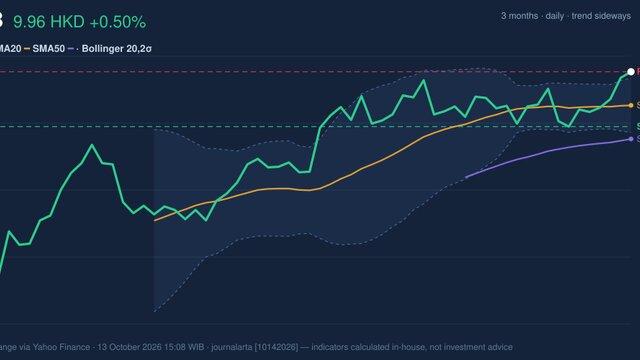
CCB Stock Technicals: Gains 0.50% on Tuesday, Testing Key Resistance
On October 13, 2026: price 9.96 HKD, trend sideways, RSI 63.7, support 9.51, resistance 9.96. technical analysis of ccb stock.
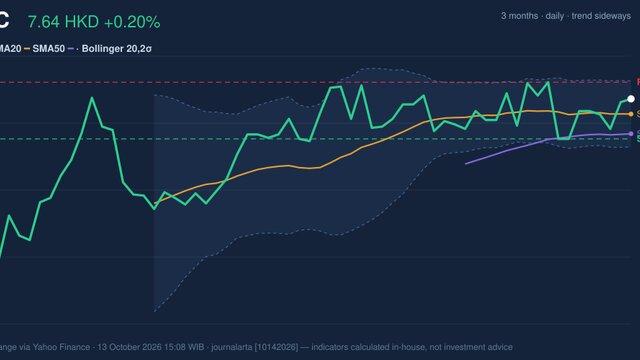
ICBC Stock Gains 0.20%, Testing Key Resistance In Focus
On October 13, 2026: price 7.64 HKD, trend sideways, RSI 54.8, support 7.45, resistance 7.71. technical analysis of icbc stock.
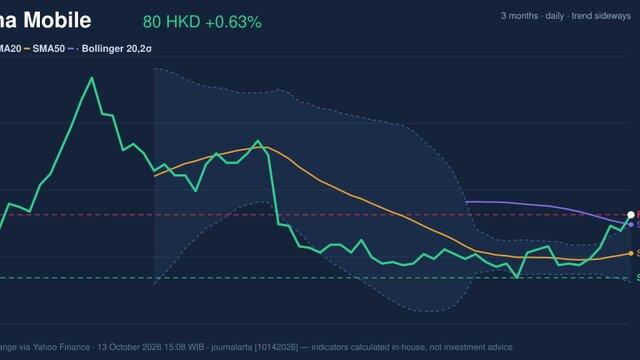
Testing Key Resistance, China Mobile Stock Gains 0.63% on Tuesday
On October 13, 2026: price 80.45 HKD, trend sideways, RSI 62.1, support 78.45, resistance 80.45. technical analysis of china mobile stock.
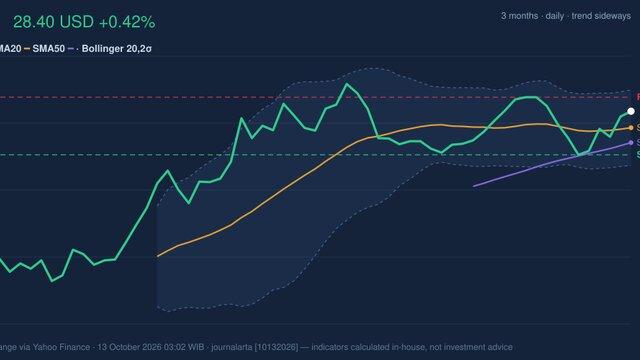
PFE Stock Gains 0.42%, Testing Key Resistance In Focus
On October 12, 2026: price 28.40 USD, trend sideways, RSI 57.5, support 27.41, resistance 28.72. technical analysis of pfe stock.
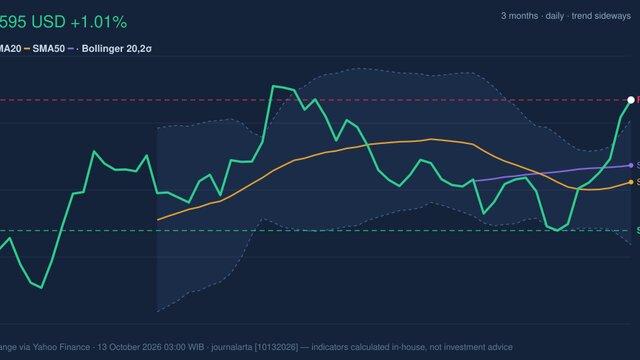
MA Stock Gains 1.01% on Monday, Testing Key Resistance
On October 12, 2026: price 595.09 USD, trend sideways, RSI 67.6, support 550.00, resistance 595.09. technical analysis of ma stock.
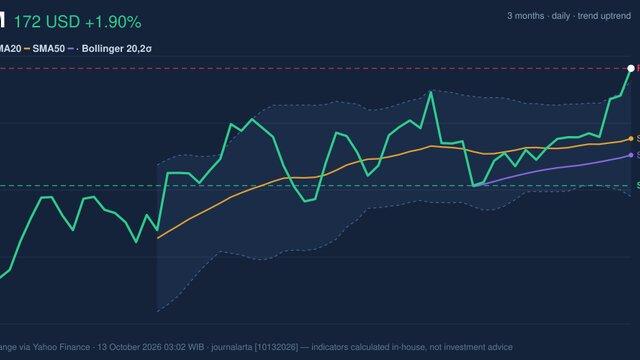
XOM Stock Gains 1.90% on Monday, Testing Key Resistance
On October 12, 2026: price 172.15 USD, trend uptrend, RSI 69.3, support 158.30, resistance 172.15. technical analysis of xom stock.
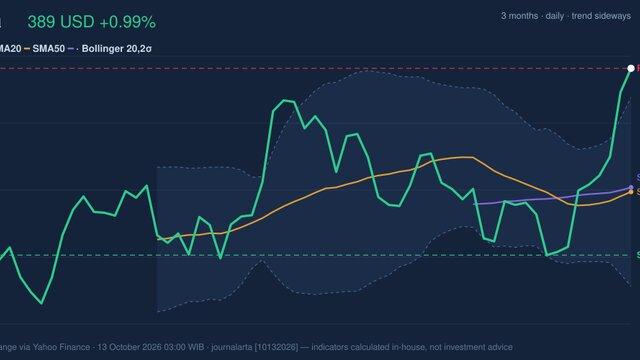
Visa Stock Technicals: Gains 0.99% on Monday, Testing Key Resistance
On October 12, 2026: price 389.27 USD, trend sideways, RSI 70.0, support 359.33, resistance 389.27. technical analysis of visa stock.
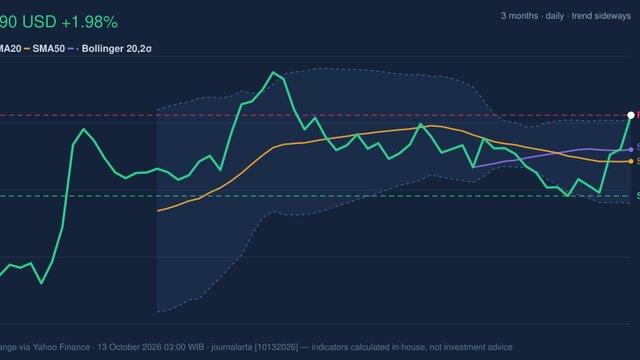
KO Testing Key Resistance: Stock Gains 1.98% (October 12, 2026)
On October 12, 2026: price 89.79 USD, trend sideways, RSI 62.0, support 85.65, resistance 89.79. technical analysis of ko stock.