The Trade Desk (TTD) Stock Tumbles 6.19%: Up 10.6% in a Month
Technical analysis of TTD stock on November 19, 2026: price 14.56 USD, trend uptrend, RSI 54.9, support 12.29, resistance 15.98.
By matthew jonathan
WIB·5 min read
Logo The Trade Desk — JournalArta illustration
Why TTD is in focus today
One-day move of 0.00%, about 0.0× its average daily range (ATR)
Selected automatically from 11 NASDAQ (US) stocks by a technical-signal score with daily weighted randomisation — not a recommendation.
The Trade Desk fell 6.19% to close at $14.56 on Thursday, November 19, 2026, according to exchange data — a sharp one-day retreat that landed the advertising-technology stock squarely on its rising 20-day average even as the broader uptrend held. The decline runs against the month: shares are still up 10.64% over the past month, while the five-day window shows a loss of 5.88%. That combination — a longer-term advance interrupted by a short, forceful pullback — is the central question for chart readers. Is this profit-taking inside a durable trend, or the first crack?
Advertisement
Trend & Price Action
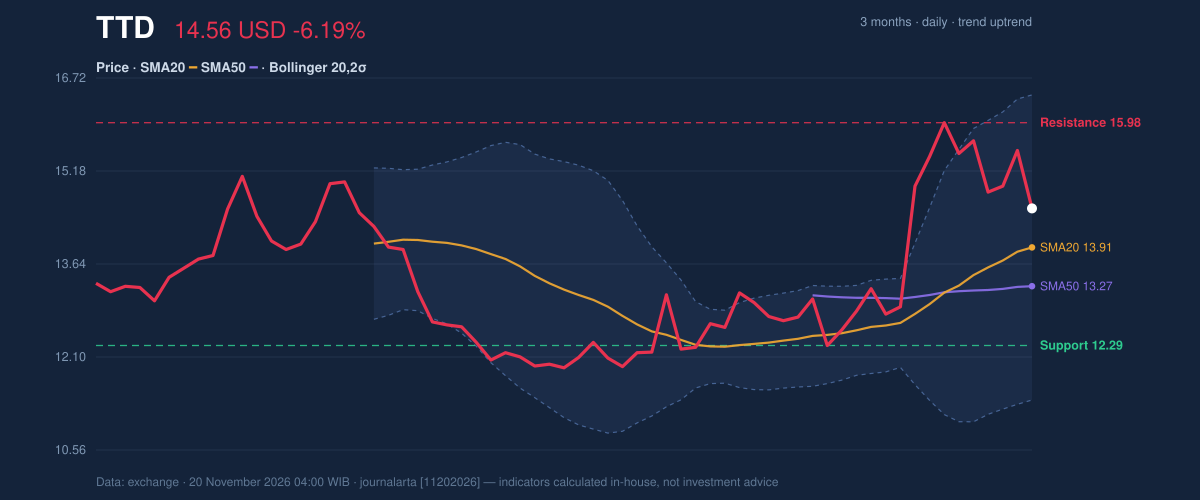
The structure still favours the bulls. The last price of $14.56 sits above the 20-day average of $13.91, which in turn is above the 50-day average of $13.27 — the classic stack of a rising market. The 20-day average itself climbed 4.75% over the past five sessions, evidence that the trend's backbone is still bending upward rather than flattening. No fresh moving-average crossover was recorded, so the established alignment remains intact.
Where the stock sits matters too. It trades at about 62% of its 20-day range, with support at $12.29 and resistance at $15.98. The three-month span between $11.62 and $16.42 frames the broader story: this is a stock that recovered from its lows and is now digesting gains well above the bottom, but short of the ceiling.
3-month price action chart of TTD: price, SMA20/50, Bollinger, support & resistance.
Advertisement
The pullback has carried the price back to the 20-day line, a level trend-followers often watch as the first test of conviction. Holding it would suggest the uptrend is absorbing supply; losing it would shift attention toward the 50-day average.
Oscillators & Momentum
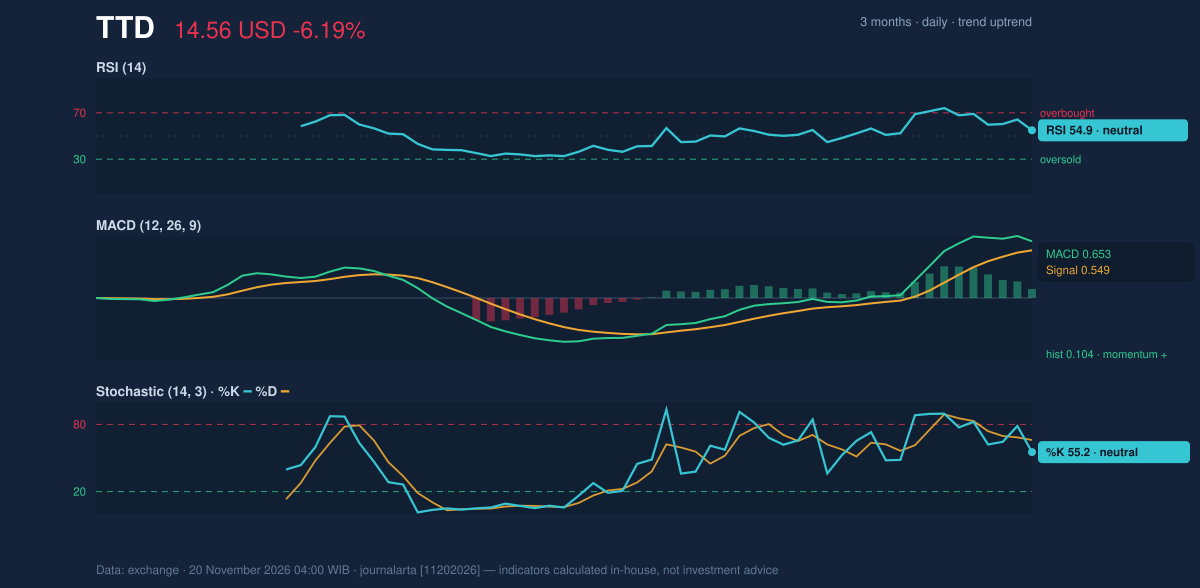
Momentum is cooling, not breaking. The 14-day RSI reads 54.9 — neutral, and notably down from an overbought reading above 65, which is the caution flag in the signal set. In plain terms, the stock has shed its froth without entering oversold territory; that is a normal reset inside an advance, though it does confirm buyers have stepped back.
Stochastic readings of %K 55.2 and %D 66.1 sit in the middle of the range, with the faster line below the slower one — a mild loss of upward pressure rather than a decisive reversal. The MACD is the counterweight: at 0.653 against a signal line of 0.549, with a positive histogram of 0.104, the trend gauge still points up. When the slow indicator stays positive while short-term measures cool, the read is usually consolidation, not a trend change.
Momentum chart of TTD: RSI(14), MACD, Stochastic.
Advertisement
Volatility & Volume
The Bollinger bands are wide and getting wider. With the upper band at $16.44 and the lower at $11.39, the band width stands at 36.3%, described as expanding — a signature of high volatility. The price sits at 63% of the band range (%B), meaning it is in the upper half but has room in both directions. The ATR of $0.98, equal to 6.7% of the price, reinforces the point: daily swings of this size are now routine, and position sizing deserves proportionally more care.
Volume offers reassurance. The latest session traded 22.3 million shares, roughly 1.0× the 20-day average — a heavy down day, but not a panic exodus. More importantly, on-balance volume is rising, indicating that cumulative buying pressure has not reversed. A pullback on ordinary volume with OBV climbing is a far gentler signal than a selloff on expanding distribution.
Advertisement
Fundamental Context
The tape is not moving in a vacuum. According to its SEC filing, The Trade Desk reported quarterly revenue of $736.0 million for the quarter ended September 30, 2026, down 0.5% from $739.4 million a year earlier, with net income of $38.1 million versus $115.5 million and diluted earnings per share of $0.08. The company filed a Form 8-K on November 9, 2026 reporting those results. For a growth name, flat revenue and a thinner bottom line explain why rallies meet resistance; the chart's message of consolidation fits the fundamentals rather than contradicting them.
Key Levels & Scenarios
The immediate pivot is the 20-day average near $13.91. A close that holds above it keeps the uptrend narrative alive, with the first real test at resistance of $15.98 and, beyond that, the three-month high of $16.42. A decisive break of that ceiling would open the upper Bollinger band at $16.44 as the next reference. On the downside, failure to defend $13.91 shifts the focus to the 50-day average at $13.27, and a deeper slide would put the 20-day support at $12.29 in play.
Advertisement
Technical Verdict: BUY
The JournalArta research verdict is BUY, scoring +66 on a −100 to +100 scale, driven by the price sitting above its 50-day average, the 20-day average above the 50-day, a confirmed uptrend, and an RSI in the constructive 50–70 zone. The strongest supporting evidence is the pullback into the rising 20-day average within an intact uptrend, accompanied by a rising OBV; the MACD's positive histogram adds confirmation. The chief risk is the RSI's rollover from above 65 — if selling accelerates, the setup weakens.
- Entry zone: $13.83 – $14.56
- Exit target 1: $17.05
- Exit target 2: $19.54
- Stop loss: $12.90
- Reward/risk: 1.5 / 3.0; setup valid until December 18, 2026
- Invalidation: the verdict is voided if the price breaks below $12.90.
In plain English: the trend is still up and this dip looks like an orderly pause, but the stop is there because momentum has clearly cooled.
The next scheduled marker is the setup's validity window, which runs to December 18, 2026.
Disclaimer: This technical analysis is generated automatically from exchange data and indicators calculated by JournalArta, for information and education only. The verdict and the entry, target and stop-loss levels are not investment advice or a solicitation to buy or sell any security. Investment decisions and their risks rest solely with the reader.

 Take the quizWhat Kind of Holiday Spender Are You? Take the Black Friday QuizStart →





 Lifestyle · Food & HealthNormal Blood Pressure Chart by Age: Healthy Ranges Explained
 Lifestyle · Food & HealthWhat Is Raynaud’s Syndrome? Why Fingers Turn White in the Cold
 Lifestyle · Food & Health4 Ways Walking After Meals Helps Your Body, Doctors Say
 Lifestyle · Food & Health4 Reasons to Eat Oatmeal, According to Nutrition Experts