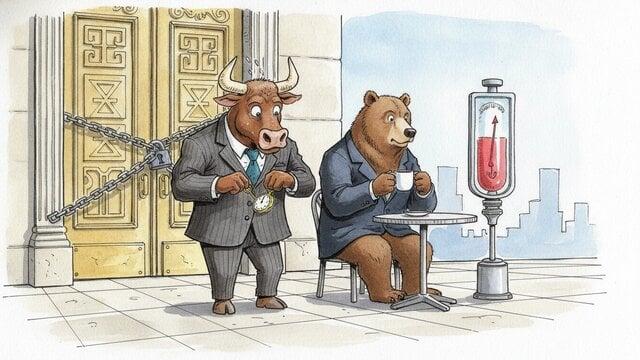
Costco (COST) Stock Update: Falls 0.25%, Up 7.4% in a Month
Technical analysis of COST stock on November 19, 2026: price 1,093.83 USD, trend uptrend, RSI 67.8, support 982.73, resistance 1,113.74.

Why COST is in focus today
Selected automatically from 11 NASDAQ (US) stocks by a technical-signal score with daily weighted randomisation — not a recommendation.
Trend & Price Action
The structural picture is firmly constructive. Costco trades above its 20-day simple moving average of 1,052.49 and well above its 50-day average of 982.78, and the 20-day average is itself rising, gaining 2.56% over five days. The faster average sits above the slower one, the textbook definition of an intact uptrend. There is no fresh moving-average crossover to report, meaning the trend has been running without a major technical reset.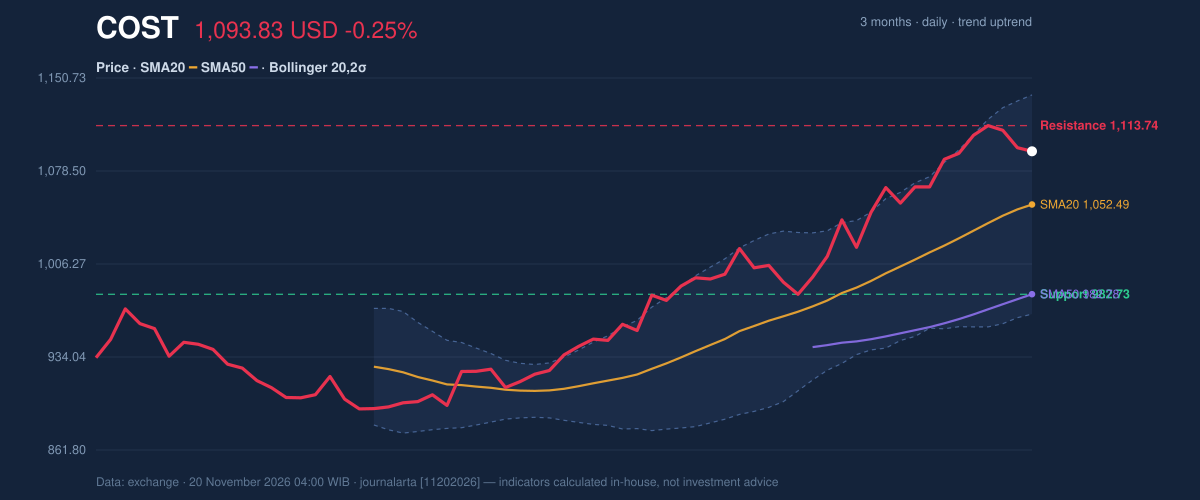
Oscillators & Momentum
Momentum is positive but not stretched. RSI(14) at 67.8 sits just below the 70 threshold that typically flags overheating — strong, but with room before buyers look exhausted. The stochastic oscillator reads %K 72.7 against %D 79.9, a mildly bearish cross configuration in neutral territory that hints at a pause rather than a turn.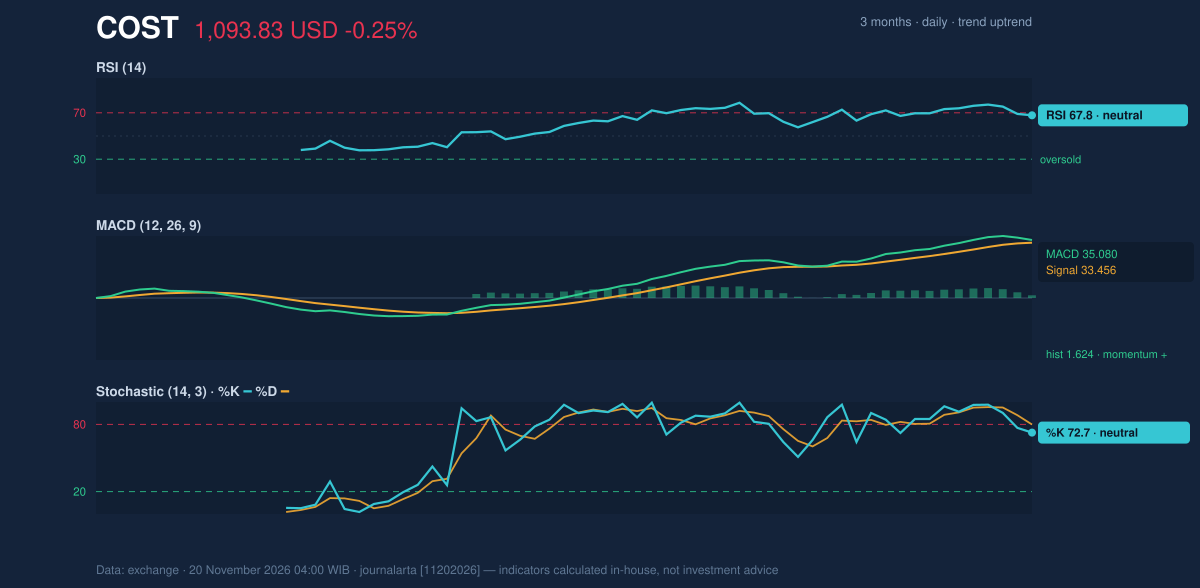
Volatility, Bands & Volume
Bollinger bands are neither squeezed nor stretched. The 20-day setup puts the upper band at 1,137.60 and the lower at 967.38, a width of 16.2% — normal conditions. The stock's %B reading of 74% places it in the upper band zone, consistent with an uptrend in good health. Average True Range of 20.97 equals roughly 1.9% of price, moderate volatility that leaves room for a normal shakeout without breaking the trend. The divergence sits in volume. Trading at 0.9× the 20-day average with OBV declining means the recent advance has not been confirmed by broad participation. In plain terms, fewer hands are carrying the stock higher — a condition that can persist in a large-cap name but rarely resolves well without a volume pickup.Fundamental Context
The technicals rest on a solid base. According to its SEC filing, Costco reported annual revenue of $303.15 billion for the fiscal year ended August 30, 2026, up 10.1% from $275.24 billion, with net income of $9.23 billion and diluted earnings per share of $20.76. The company also filed a Form 8-K on November 10, 2026, reporting a change of directors or officers and other material events — a governance item worth monitoring.Technical Verdict: BUY
The JournalArta Research verdict is BUY, with a score of +68 on a −100 to +100 scale where +60 marks a buy. Three signals carry the call: the price trades above its 50-day average, the 20-day average has risen above the 50-day, and the uptrend remains intact with RSI at 67.8 in the healthy 50–70 zone. The verdict is invalidated if price falls below 1,058.12. - Entry range: 1,078.08 – 1,093.83 - Exit target 1: 1,147.39 - Exit target 2: 1,200.96 - Stop loss: 1,058.12 - Reward/risk: 1.5 / 3.0, valid until December 18, 2026 For non-traders: the trend and momentum indicators still favor the upside, but the weak volume means this is a position to hold with discipline rather than chase. Trading volume of 2,130,100 shares on the session was the lowest of the week against a 20-day average of 2,467,155.Summary Data COST
| Last price | 1,093.83 USD |
| Change 1 day / 5 days / 1 month | -0.25% / 0.15% / 7.43% |
| Trend / MA-cross | uptrend / none |
| SMA20 / SMA50 | 1,052.49 / 982.78 |
| RSI (14) / Stochastic %K | 67.8 / 72.7 |
| Bollinger %B / ATR | 74% / 20.97 |
| Support / Resistance 20 days | 982.73 / 1,113.74 |
| Data as of | 20 November 2026 04:00 WIB |
| JournalArta research verdict (score) | Buy (+68) |
| Entry zone | 1,078.08 – 1,093.83 |
| Target 1 / 2 | 1,147.39 / 1,200.96 |
| Stop loss | 1,058.12 |
| Reward/risk | 1.5 / 3.0 |
Today's full Buy and Sell list for US stocks →
Disclaimer: This technical analysis is generated automatically from exchange data and indicators calculated by JournalArta, for information and education only. The verdict and the entry, target and stop-loss levels are not investment advice or a solicitation to buy or sell any security. Investment decisions and their risks rest solely with the reader.
Track COST stock price daily: live levels, support/resistance and our full COST analysis history.
 Take the quizWhat Kind of Holiday Spender Are You? Take the Black Friday QuizStart →





 Lifestyle · Food & HealthNormal Blood Pressure Chart by Age: Healthy Ranges Explained
 Lifestyle · Food & HealthWhat Is Raynaud’s Syndrome? Why Fingers Turn White in the Cold
 Lifestyle · Food & Health4 Ways Walking After Meals Helps Your Body, Doctors Say
 Lifestyle · Food & Health4 Reasons to Eat Oatmeal, According to Nutrition Experts