Eli Lilly (LLY) Stock Technicals: Rises 1.44% on Tuesday, Testing Key Resistance
Technical analysis of LLY stock on November 10, 2026: price 1,432.29 USD, trend uptrend, RSI 69.8, support 1,208.74, resistance 1,432.29.
By matthew jonathan
November 11, 20264 min read
Advertisement
Logo Eli Lilly — JournalArta illustration
Why LLY is in focus today
Trading near its 3-month high (1,453.00)
Uptrend confirmed (5-day change 1.63%)
Selected automatically from 80 NYSE (US) stocks by a technical-signal score with daily weighted randomisation — not a recommendation.
Eli Lilly closed at $1,432.29 on Tuesday, November 10, 2026, up 1.44% for the session and 1.63% over five days, putting the share price at its three-month peak. The move is worth watching because it combines a confirmed rising trend with a price pressing against a level where momentum could either carry forward or stall.
Trend & Price Action
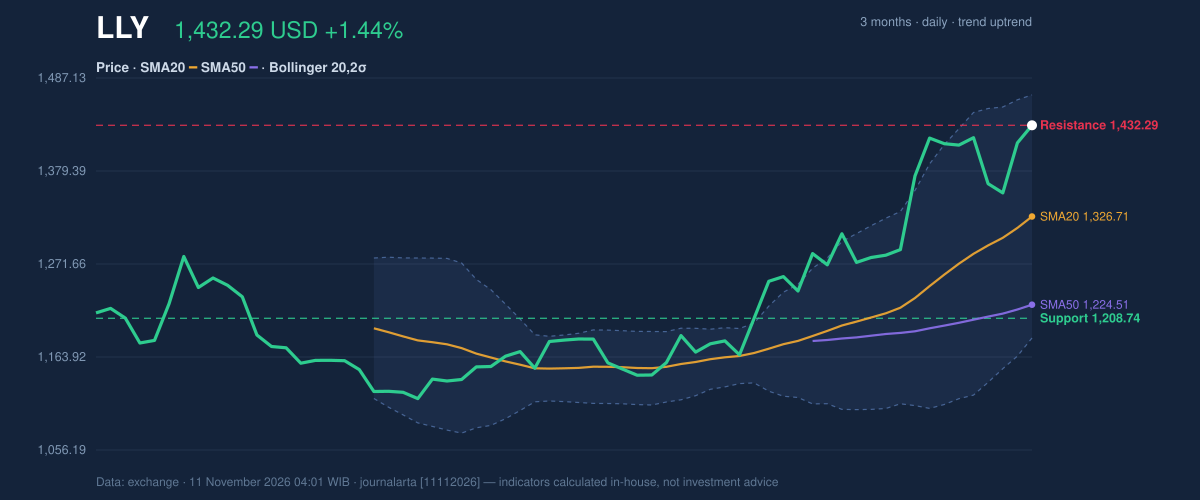
The share price is above both its 20-day simple moving average (SMA), at $1,326.71, and its 50-day SMA, at $1,224.51. The 20-day average has risen 4.30% over five days, indicating that the shorter-term trend is strengthening rather than merely reflecting a one-day jump. There was no new moving-average crossover in the latest session; instead, the existing alignment supports the uptrend.
Lilly is at 100% of its 20-day trading range, with $1,432.29 also the stated 20-day resistance. It remains close to, but below, its three-month high of $1,453.00. That positioning signals strong demand, but leaves little room before the stock meets the recent peak. As shown in the chart, the price is also nearing the upper Bollinger Band at $1,467.54.
3-month price action chart of LLY: price, SMA20/50, Bollinger, support & resistance.
Advertisement
Momentum & Volatility
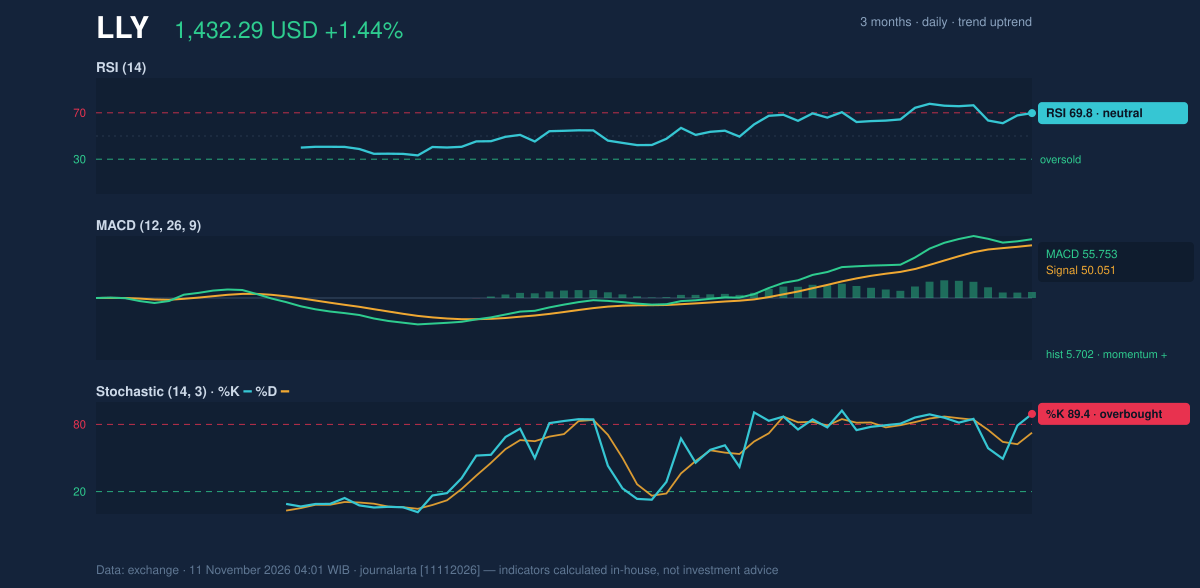
The indicators are positive, though they show different degrees of heat. The MACD is positive at 55.753, above its 50.051 signal line, with a positive 5.702 histogram—a configuration consistent with upward momentum. The RSI is 69.8, classified as neutral in the supplied data and close to the commonly watched overbought threshold. Meanwhile, the Stochastic is overbought: %K at 89.4 and %D at 72.6. In plain terms, momentum favors the trend, but short-term buying may be stretched.
Momentum chart of LLY: RSI(14), MACD, Stochastic.
The Bollinger Band %B reading is 87%, placing the price toward the upper part of the band. Its 21.2% width is expanding, a sign of elevated volatility rather than a tight, quiet trading range. The 14-day average true range (ATR) is $53.57, or 3.7% of the share price, underscoring that daily moves can be substantial. These measures do not establish direction, but they make a pause or sharp swing more plausible.
Volume was 3,017,000 shares, close to the 20-day average of 3,131,260, or 1.0 times normal. The rising on-balance volume (OBV), which tracks whether trading volume is flowing more with advances or declines, adds confirmation that participation has been supportive. Still, the near-average volume suggests the latest session was not an unusually strong surge of trading.
Advertisement
Key Levels & Scenarios
The immediate test is the $1,432.29 resistance, which coincides with the latest price and the top of the stated 20-day range. A move beyond that area would put the three-month high of $1,453.00 in focus. Failure to hold the supplied entry zone’s lower boundary of $1,392.12 would weaken the near-term setup; the rising 20-day average at $1,326.71 is a deeper trend reference. The 20-day support is $1,208.74, though it sits well below the current price.
Fundamental Context
According to its SEC filing, Lilly reported revenue of $24.40 billion for the quarter ended September 30, 2026, up 38.6% from $17.60 billion a year earlier. Net income was $6.45 billion, compared with $5.58 billion in the prior-year quarter, and diluted earnings per share were $7.22. The company filed its results with the U.S. Securities and Exchange Commission on October 29. Those figures provide business context for the share’s strength, while the verdict below is based on the stated technical signals.
Advertisement
Technical Verdict: BUY
The JournalArta Research verdict is BUY, with a score of +68 on a −100 to +100 scale. The strongest technical supports are the price above its 50-day average, the 20-day average above the 50-day, and a confirmed uptrend with rising OBV. The MACD also remains positive, although the overbought Stochastic and elevated volatility are risks. The verdict is invalidated if the price falls below $1,341.22.
- Ideal Entry Range: $1,392.12–$1,432.29
- Exit Targets: Target 1: $1,568.89; Target 2: $1,705.50
- Stop Loss: $1,341.22
- Reward/risk: 1.5 / 3.0
- Validity: Through December 9, 2026
For non-traders, the technical reading favors the upward trend, but the price is near a recent peak and momentum is already stretched.
Disclaimer: This technical analysis is generated automatically from exchange data and indicators calculated by JournalArta, for information and education only. The verdict and the entry, target and stop-loss levels are not investment advice or a solicitation to buy or sell any security. Investment decisions and their risks rest solely with the reader.