Aristocrat Leisure Share Price Rises 0.00% (November 11, 2026): Testing Key Resistance
Technical analysis of Aristocrat stock on November 11, 2026: price 65.89 AUD, trend uptrend, RSI 64.0, support 62.64, resistance 66.05.

Why Aristocrat is in focus today
- Trading near its 3-month high (66.71)
- Not covered by JournalArta in the last 14 days
Selected automatically from 58 ASX (Australia) stocks by a technical-signal score with daily weighted randomisation — not a recommendation.
Trend & Price Action
The structure is constructive. Price trades above the 20-day simple moving average (SMA20) at A$64.41 and the 50-day average at A$61.98. The 20-day average has risen 1.59% over five days, which says the stock's recent closing prices have been steadily higher, not that the shares themselves gained 1.59%. No new moving-average crossover has formed; the 20-day average already sits above the 50-day, so the uptrend is established, not freshly signalled. As shown in the chart, the price is hugging the upper part of its 20-day band.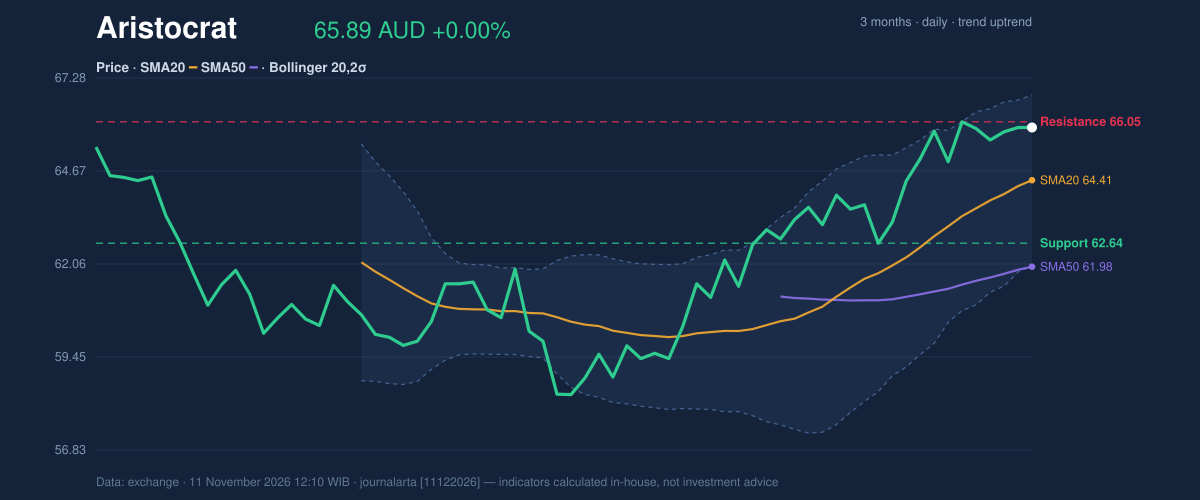
Oscillators & Momentum
Momentum is positive but stretched. The Relative Strength Index (RSI), a 0–100 gauge of how fast prices have risen against how fast they have fallen, reads 64.0, inside the neutral zone and below the conventional 70 overbought line. The Stochastic oscillator, which tracks where the close sits within its recent high-low range, is hotter: %K at 80.7 and %D at 80.0, both in overbought territory. The two readings disagree, and that matters. RSI says there is headroom; Stochastic says the stock is already near the top of its short-term range. Code-based signals add a cautionary note: RSI is rolling over from above 65, the single bearish signal in the technical set. The Moving Average Convergence Divergence (MACD) line, which measures the gap between short- and long-term momentum, stands at 1.153 against a signal line of 1.074. The histogram of 0.079 is positive, so momentum still leans upward, but the margin is thin.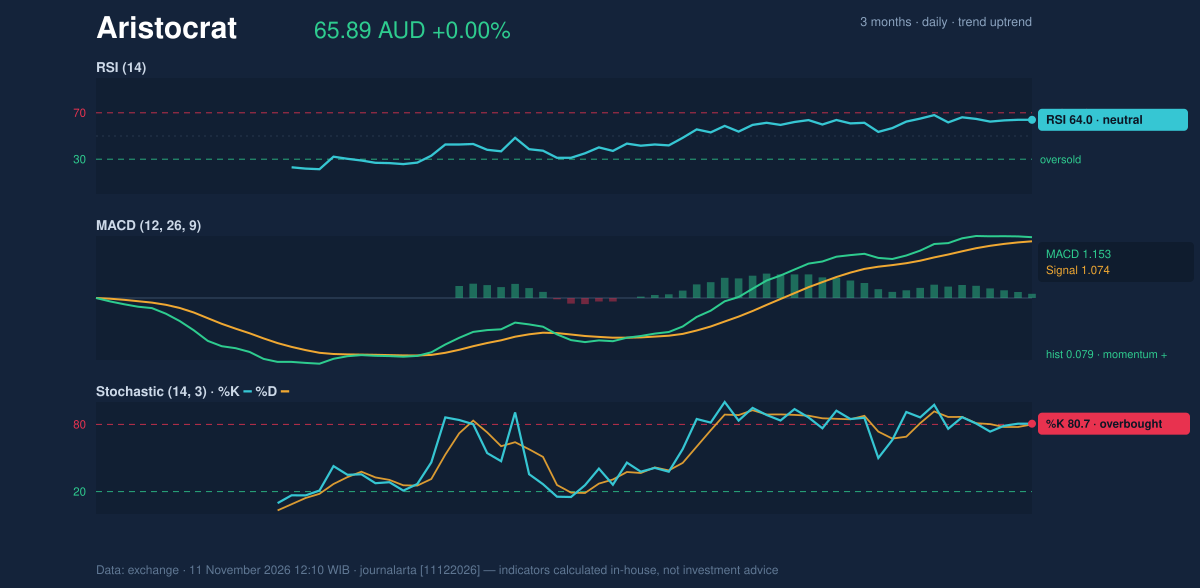
Volatility & Volume
The Bollinger Bands, which draw a channel two standard deviations around the 20-day average, span A$62.01 to A$66.81. Price sits at 81% of the band (%B), and the band width has narrowed to 7.4%. A narrowing band is often called a squeeze: volatility has been compressed, and compressed markets tend to resolve with a larger move. The data cannot say in which direction. Average True Range (ATR), a measure of typical daily movement, is A$1.21, or 1.8% of the price, a moderate level. Volume offers some support for the bulls: 1,903,098 shares changed hands, about 1.5 times the 20-day average of 1,303,663, and On-Balance Volume, which adds volume on up days and subtracts it on down days, is rising. Heavier participation without a price gain can mean buyers are absorbing supply near resistance, though it can also reflect sellers meeting the rally.Key Levels & Scenarios
The reference levels are tight. Resistance at A$66.05 comes first, then the three-month high at A$66.71. Below, the 20-day support at A$62.64 is the line that matters, with the three-month low at A$57.71 far further down. The ATR-based bands put A$64.08 (price minus 1.5 times ATR) and A$67.70 (price plus 1.5 times ATR) on either side of the last close. A close above A$66.05 would show buyers clearing the month's ceiling. A break below A$62.64 would damage the pattern of higher lows behind the uptrend.Technical Verdict: HOLD (wait & see)
The JournalArta research score is +58 on a scale from −100 to +100, just short of the +60 threshold for a buy call. The verdict is HOLD (wait & see), because trend and momentum are not yet aligned. Strongest reasons: - Trend is positive: price is above both averages and the 20-day average is above the 50-day. - Momentum is mixed: Stochastic is overbought at 80.7 and RSI is rolling over from above 65, even as MACD stays positive. - Price is boxed in: it sits at 95% of the 20-day range, with a Bollinger squeeze pending. Conditional scenarios, drawn only from the reference levels: - Upside entry range: a close above A$66.05 - Exit target: A$67.70 (price plus 1.5 times ATR) - Downside scenario: a break below A$62.64 - Stop-loss protection: A$64.08 (price minus 1.5 times ATR), applying to the upside scenario The verdict is invalidated if price falls below A$62.64, the 20-day support. For non-traders, the stock is in a healthy uptrend but has run close to its ceiling, so the chart favours waiting for a clearer break before reading a new direction into it.Summary Data Aristocrat
| Last price | 65.89 AUD |
| Change 1 day / 5 days / 1 month | 0.00% / -0.24% / 5.26% |
| Trend / MA-cross | uptrend / none |
| SMA20 / SMA50 | 64.41 / 61.98 |
| RSI (14) / Stochastic %K | 64.0 / 80.7 |
| Bollinger %B / ATR | 81% / 1.21 |
| Support / Resistance 20 days | 62.64 / 66.05 |
| Data as of | 11 November 2026 12:10 WIB |
| JournalArta research verdict (score) | Hold (+58) |
Today's full Buy and Sell list for US stocks →
Disclaimer: This technical analysis is generated automatically from exchange data and indicators calculated by JournalArta, for information and education only. The verdict and the entry, target and stop-loss levels are not investment advice or a solicitation to buy or sell any security. Investment decisions and their risks rest solely with the reader.
Track Aristocrat share price daily: live levels, support/resistance and our full Aristocrat analysis history.