Westpac Share Price Falls 0.00% (November 11, 2026): Testing Key Resistance
Technical analysis of Westpac stock on November 11, 2026: price 37.29 AUD, trend uptrend, RSI 61.3, support 35.13, resistance 37.29.

Why Westpac is in focus today
- Trading near its 3-month high (37.71)
- Uptrend confirmed (5-day change 1.77%)
- Not covered by JournalArta in the last 14 days
Selected automatically from 58 ASX (Australia) stocks by a technical-signal score with daily weighted randomisation — not a recommendation.
Trend and Price Action
The trend structure is clean. The price sits above the 20-day simple moving average (SMA20) at 36.51, which in turn sits above the 50-day average (SMA50) at 35.35. That stacking, short average over long average with price on top, is the standard signature of an uptrend. The 20-day average rose 1.64% over five days, which shows the advance is broad-based rather than a one-day spike. No new moving-average crossover has formed. That matters for interpretation: the 20-day average's position above the 50-day is an established condition, not a fresh "golden cross" event. As shown in the chart, the 20-day range runs from support at 35.13 to resistance at 37.29, and the latest close sits at 100% of that range. In plain terms, Westpac is trading at the very top of its recent band.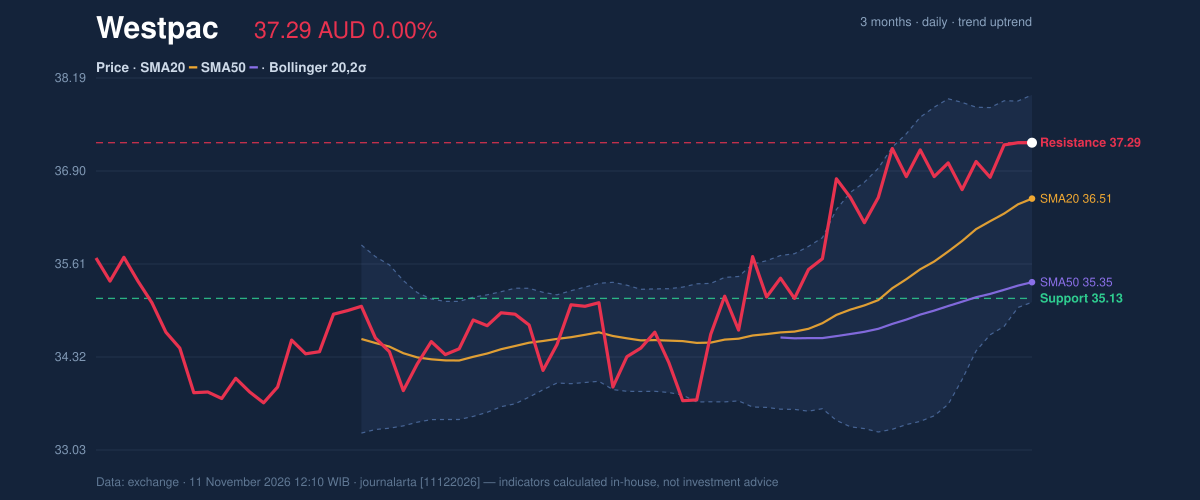
Oscillators and Momentum
Momentum is supportive without being stretched. The 14-day Relative Strength Index (RSI), a gauge from 0 to 100 of how strongly price has been rising versus falling, reads 61.3. That is neutral territory, well short of the 70 level often read as overbought, so the rally has room before it looks exhausted. The Stochastic oscillator, which measures where the close sits within its recent range, shows %K at 78.7 and %D at 79.8, also neutral but leaning high, consistent with a price near its range top. The MACD (moving average convergence divergence), which tracks the gap between short- and long-term price averages, reads 0.574 against a signal line of 0.558. The histogram of 0.016 is positive but thin. That is the key nuance: momentum is still pointing up, yet the margin over its signal line is narrow, so it would not take much of a stall to flip it.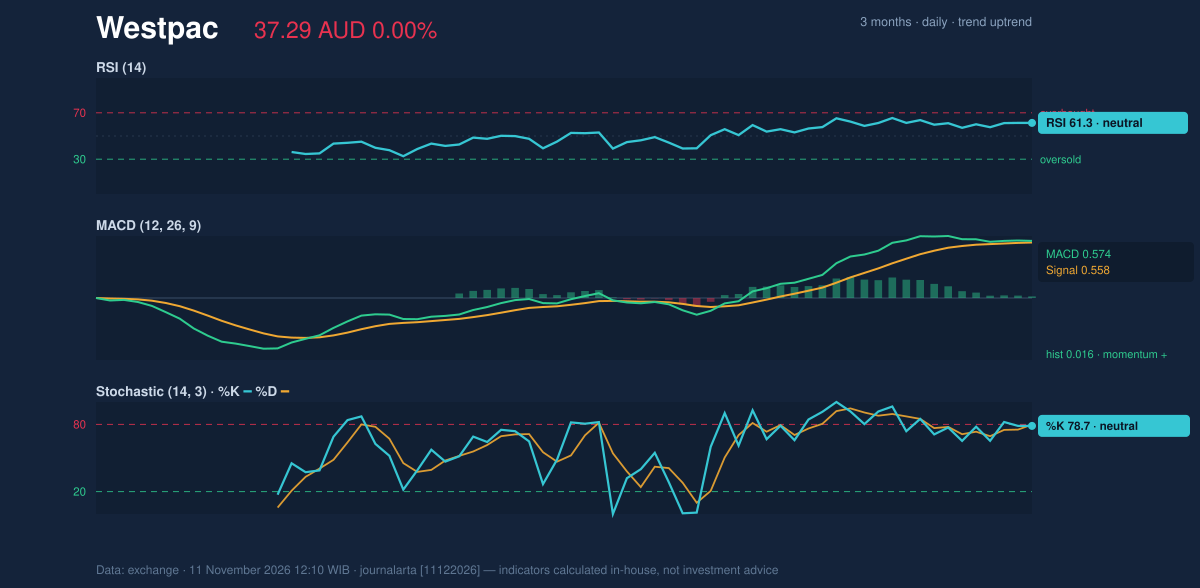
Volatility and Volume
The Bollinger Bands, a volatility envelope set two standard deviations around the 20-day average, span 35.08 to 37.95. The bands have narrowed to a width of 7.9%, a "squeeze" that often precedes a larger move, though the squeeze itself does not signal direction. The %B reading of 77% places the price in the upper part of the envelope, with the upper band at 37.95 only about 0.66 above the close. The Average True Range (ATR), a measure of typical daily movement, is 0.83, or 2.2% of the price, which marks moderate volatility. Volume offers a mixed message. Wednesday's turnover of 4,478,355 shares was 0.8 times the 20-day average of 5,955,902, a quieter session. Yet On-Balance Volume (OBV), which adds volume on up days and subtracts it on down days, is rising. Participation on the way up has outweighed selling, and the light volume on a flat day looks more like a rest than a retreat.Key Levels and Scenarios
The immediate test is the three-month high of 37.71, just 1.1% above the close. A move through it, backed by stronger volume than Wednesday's, would put the price outside its recent range and keep the Bollinger squeeze in play. If the price fails there, the first cushion is the SMA20 at 36.51, with the 20-day support at 35.13 beneath it. The three-month low sits much further away at 33.46.Technical Verdict: BUY
JournalArta's research model scores Westpac at +76 on a scale of −100 to +100, above the +60 threshold for a BUY call. The strongest reasons: - Trend structure: price is above the 50-day average, the 20-day average is above the 50-day, and the 20-day average rose 1.64% over five days. - Signal balance: two bullish technical signals against zero bearish, including a pullback to the SMA20 within an uptrend. - Volume confirmation: OBV is rising, and MACD's histogram is positive at 0.016. The verdict is invalidated if the price falls below the stop-loss level of 35.88. Risks to watch: the thin MACD margin, the Stochastic reading near 79, and the below-average volume. Levels (valid until 9 December 2026): - Entry range: 36.67 – 37.29 - Exit target 1: 39.40 (reward/risk 1.5) - Exit target 2: 41.52 (reward/risk 3.0) - Stop loss: 35.88 For non-traders: the indicators describe a steady, orderly climb in Westpac shares that still looks intact, with a clear price level at which that reading would be proven wrong. This is technical analysis, not an investment recommendation. Next marker: the 37.71 three-month high, which the shares will test on the next sessions. | Indicator | Value | |---|---| | Last price (11 Nov 2026) | A$37.29 | | Change: 1 day / 5 days / 1 month | 0.00% / 1.77% / 4.42% | | SMA20 / SMA50 | 36.51 / 35.35 | | Bollinger (upper / middle / lower) | 37.95 / 36.51 / 35.08 | | RSI(14) | 61.3 | | Stochastic %K / %D | 78.7 / 79.8 | | MACD / signal / histogram | 0.574 / 0.558 / 0.016 | | ATR(14) | 0.83 (2.2%) | | Volume vs 20-day average | 4,478,355 vs 5,955,902 (0.8×) | | 20-day support / resistance | 35.13 / 37.29 | | 3-month high / low | 37.71 / 33.46 |Summary Data Westpac
| Last price | 37.29 AUD |
| Change 1 day / 5 days / 1 month | 0.00% / 1.77% / 4.42% |
| Trend / MA-cross | uptrend / none |
| SMA20 / SMA50 | 36.51 / 35.35 |
| RSI (14) / Stochastic %K | 61.3 / 78.7 |
| Bollinger %B / ATR | 77% / 0.83 |
| Support / Resistance 20 days | 35.13 / 37.29 |
| Data as of | 11 November 2026 12:10 WIB |
| JournalArta research verdict (score) | Buy (+76) |
| Entry zone | 36.67 – 37.29 |
| Target 1 / 2 | 39.40 / 41.52 |
| Stop loss | 35.88 |
| Reward/risk | 1.5 / 3.0 |
Today's full Buy and Sell list for US stocks →
Disclaimer: This technical analysis is generated automatically from exchange data and indicators calculated by JournalArta, for information and education only. The verdict and the entry, target and stop-loss levels are not investment advice or a solicitation to buy or sell any security. Investment decisions and their risks rest solely with the reader.
Track Westpac share price daily: live levels, support/resistance and our full Westpac analysis history.