CrowdStrike (CRWD) Stock on Monday: Rises 5.38%, Death Cross Pressure
Technical analysis of CRWD stock on November 9, 2026: price 228.58 USD, trend downtrend, RSI 42.2, support 216.90, resistance 268.02.

CrowdStrike (CRWD) closed at $228.58 on Monday, November 9, 2026, a 5.38% jump from the previous close of $216.90. The rally came one session after a bearish milestone: the 20-day average crossed below the 50-day average, a "death cross" that technicians read as a sign the medium-term trend has turned down. Over five days the stock is still down 5.47%, and over one month down 13.09%, so Monday's gain sits inside a broader slide.
Why CRWD is in focus today
- Fresh death cross: SMA20 crossed below SMA50
- Downtrend extending (5-day change -5.47%)
- Not covered by JournalArta in the last 14 days
Selected automatically from 100 NASDAQ (US) stocks by a technical-signal score with daily weighted randomisation — not a recommendation.
Trend & Price Action
The 20-day simple moving average (SMA20) stands at 243.55 and the 50-day (SMA50) at 243.98. The two lines are nearly touching, but the direction matters more than the gap. The 20-day average has fallen 3.89% over five days, meaning the stock's recent average cost is shrinking quickly. That is the slope of the average itself, not the stock's own price change.
The death cross appeared on the latest session, so it is fresh. Price is also below both averages, which means every holder who bought over the past 20 to 50 sessions is, on average, sitting on a loss. Those holders often sell into rallies to get back to even, which is why averages can act as a ceiling.
Monday's bounce fits that pattern. The stock rallied toward the SMA20 without reaching it, leaving a gap of roughly 15 points. A rise that stalls below a falling average is a classic "bounce within a downtrend" rather than a reversal.
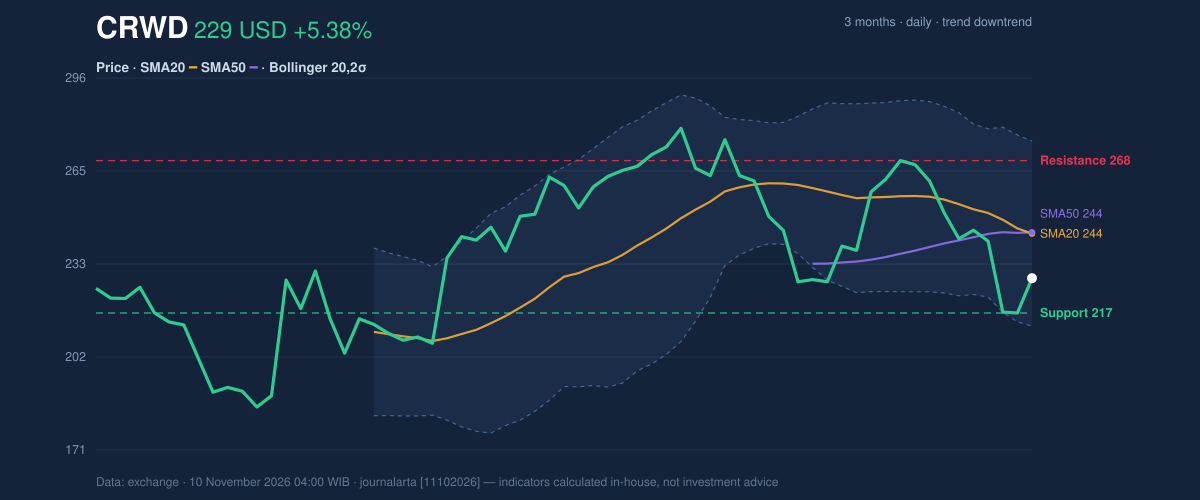
As shown in the chart, price sits in the lower part of its recent range. Over 20 sessions the support level is 216.90 and resistance is 268.02, and the stock trades at 23% of that range. The three-month high is 286.99 and the low is 181.24, so CrowdStrike remains well above its floor but has given back a large part of its climb.
Oscillators & Momentum
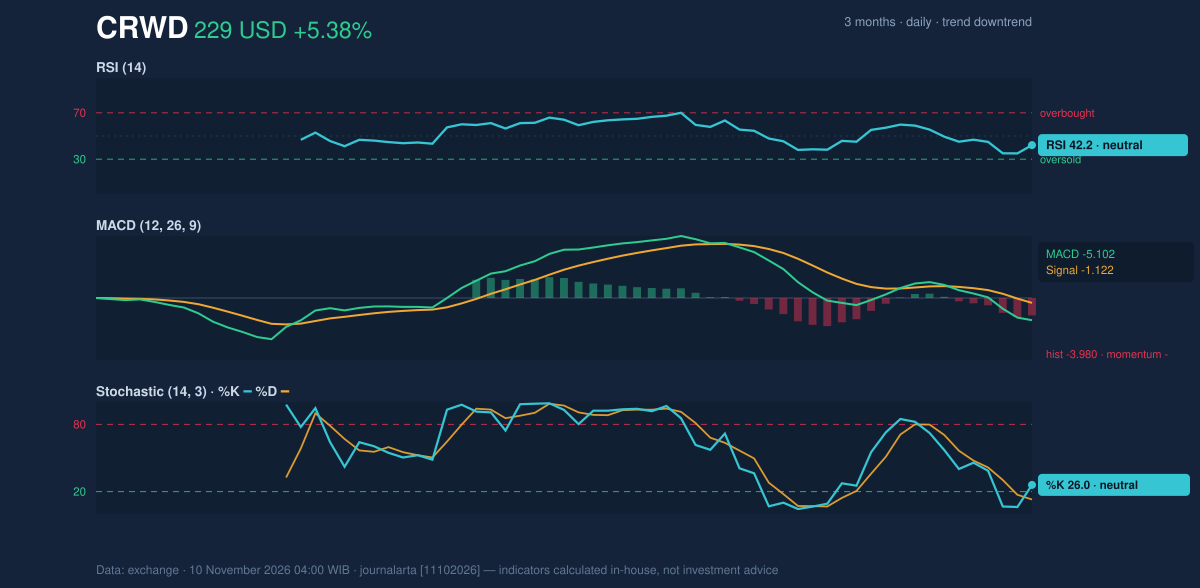
The RSI(14) reads 42.2, in neutral territory. The relative strength index compares the size of recent gains with recent losses on a 0-100 scale. Below 50 shows sellers have had the upper hand, but 42 is nowhere near the 30 mark that signals exhausted selling. In plain terms, the stock is weak but not yet washed out.
The Stochastic oscillator shows %K at 26.0 and %D at 13.0, also neutral. %K above %D usually points to a short-term upturn, and that is what Monday's rally produced. But both readings remain low, so the bounce has not changed the larger picture.
The MACD is -5.102 against a signal line of -1.122, leaving a histogram of -3.980. The MACD measures the gap between a fast and a slow average of price. A negative reading that sits well below its signal line shows downward momentum is still building, not fading.
Volatility & Volume
The Bollinger Bands, which wrap two standard deviations around the SMA20, run from 212.51 at the bottom to 274.59 at the top. Band width is 25.5% and widening, a sign that volatility is rising. The stock's %B is 26%, meaning it trades in the lower quarter of the band. Widening bands during a downtrend usually mean that moves are getting larger, not that a reversal is near.
The Average True Range (ATR) of 15.27 is 6.7% of the share price. That implies a typical daily swing of roughly 15 points, so a $228 stock can move to the support or the SMA20 within a day or two.
Volume tells a cautious story. Monday's turnover of 8,519,900 shares was 0.9 times the 20-day average of 9,831,375. A 5% rally on below-average volume suggests buyers were not rushing in. On-balance volume (OBV), which tallies volume on up days against down days, is still falling, a sign that selling pressure has outweighed buying over recent weeks.
Fundamental Context
The technical weakness contrasts with solid business results. According to its SEC filing (Form 10-Q, filed August 27), CrowdStrike reported quarterly revenue of $1.47 billion for the quarter ended July 31, up 25.8% from $1.17 billion a year earlier. It posted net income of $5.3 million, against a net loss of $70.2 million a year earlier, with diluted earnings per share of $0.01. A company can grow while its shares fall; price action reflects what investors are willing to pay, which can shift faster than earnings.
Technical Verdict: SELL
JournalArta's research model scores CRWD at -84 on a scale of -100 to +100, in the sell territory (at or below -60). The call rests on three signals and no bullish counterweight:
- Fresh death cross: the SMA20 (243.55) has slipped below the SMA50 (243.98).
- Bounce inside a downtrend: price is below both averages, and Monday's rise fell short of the SMA20.
- Falling OBV: volume flow confirms the downtrend, and the MACD histogram at -3.980 shows momentum still pointing down.
The levels below are computed by the model and are valid until December 8, 2026:
- Entry range (sell zone): 228.58 – 240.03
- Exit target 1: 189.64 (reward/risk 1.5)
- Exit target 2: 150.70 (reward/risk 3.0)
- Stop loss: 254.54
The verdict is invalidated if price rises above 254.54. The risk to the call is clear: the RSI at 42.2 and Stochastic at 26.0 are not oversold, but a quick rebound is still possible, and with the ATR at 15.27 such moves can happen fast.
This is technical analysis, not investment advice. In plain terms, the chart says CrowdStrike's short-term pattern is weaker than its recent bounce suggests, and the model sees more downside risk than upside until the stock reclaims its averages.
CrowdStrike's next test is the 216.90 support, the level it held in Monday's session, with the SMA20 at 243.55 as the first hurdle on any further recovery.
Summary Data CRWD
| Last price | 228.58 USD |
| Change 1 day / 5 days / 1 month | 5.38% / -5.47% / -13.09% |
| Trend / MA-cross | downtrend / death |
| SMA20 / SMA50 | 243.55 / 243.98 |
| RSI (14) / Stochastic %K | 42.2 / 26.0 |
| Bollinger %B / ATR | 26% / 15.27 |
| Support / Resistance 20 days | 216.90 / 268.02 |
| Data as of | 10 November 2026 04:00 WIB |
| JournalArta research verdict (score) | Sell (-84) |
| Sell zone | 228.58 – 240.03 |
| Target 1 / 2 | 189.64 / 150.70 |
| Stop loss | 254.54 |
| Reward/risk | 1.5 / 3.0 |
Today's full Buy and Sell list for US stocks →
Disclaimer: This technical analysis is generated automatically from exchange data and indicators calculated by JournalArta, for information and education only. The verdict and the entry, target and stop-loss levels are not investment advice or a solicitation to buy or sell any security. Investment decisions and their risks rest solely with the reader.
Track CRWD stock price daily: live levels, support/resistance and our full CRWD analysis history.