Sembcorp Industries Share Price Falls 3.57% (November 6, 2026): Testing Support Level
Technical analysis of Sembcorp stock on November 6, 2026: price 5.68 SGD, trend downtrend, RSI 37.8, support 5.68, resistance 6.08.

Sembcorp Industries fell 3.57% on the Singapore Exchange on Friday, November 6, to S$5.68, as a surge in trading volume accompanied a close below its lower Bollinger Band. The move was about 1.5 times the average daily range, while volume reached 1.6 times its 20-session average, signals that the decline drew stronger participation rather than reflecting a quiet drift. The shares are down 2.91% over five sessions and 3.73% over one month.
Why Sembcorp is in focus today
- One-day move of -3.57%, about 1.5× its average daily range (ATR)
- Volume at 1.6× the 20-day average
- Breaking out of a Bollinger squeeze (band width 6.8%)
- Downtrend extending (5-day change -2.91%)
Selected automatically from 32 SGX (Singapore) stocks by a technical-signal score with daily weighted randomisation — not a recommendation.
Trend & Price Action
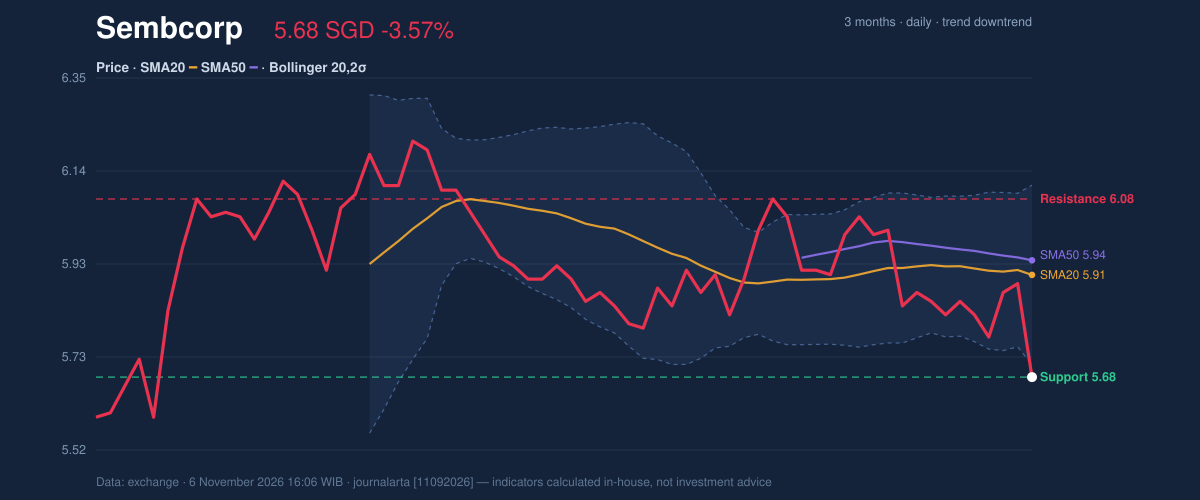
Sembcorp closed below its S$5.91 20-day moving average and S$5.94 50-day average, leaving the short-term price structure tilted down. The 20-day average itself fell 0.33% over five days, confirming that the weakness is not just a gap between price and an otherwise rising trend. There was no new moving-average crossover in the latest session.
The close at S$5.68 sits at the stated 20-session support and the bottom of the reported 20-session range. The shares also broke below the lower Bollinger Band at S$5.71; Bollinger Bands track price volatility around a moving average, and a close outside the band can signal that selling pressure has intensified. The band width was 6.8%, with the squeeze resolving to the downside. That matters because a squeeze reflects unusually contained volatility before a sharper move; here, the initial break favored sellers.
As shown in the chart, price is below both moving averages and the lower band, with support and resistance framing the next test.
Oscillators & Momentum
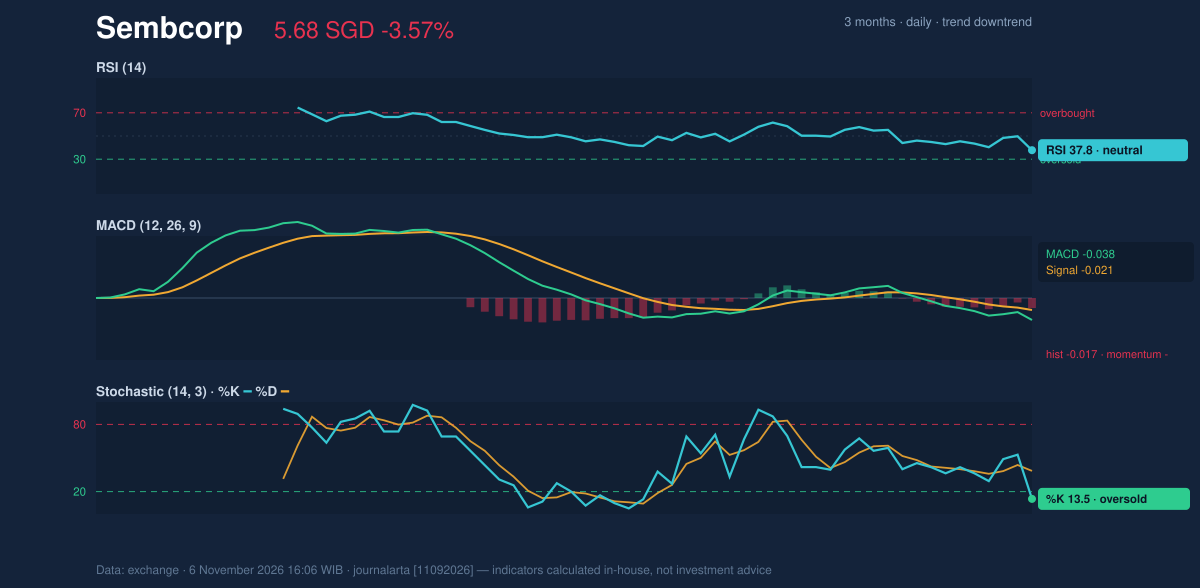
Momentum indicators lean negative, although the stochastic reading warns that the decline may be stretched in the short term. The RSI is 37.8, a neutral reading that shows weakening momentum but does not, by itself, establish an oversold condition. Stochastic %K at 13.5 and %D at 38.5 are in oversold territory, meaning recent losses have been steep relative to the instrument’s recent trading range; that can precede a pause, but is not confirmation of a reversal.
The MACD is -0.038, below its -0.021 signal line, while its -0.017 histogram is negative. MACD compares short- and longer-term price momentum; these readings indicate that downside momentum remains in control. The oversold stochastic has not yet been confirmed by a positive MACD turn.
The chart brings the RSI, MACD and stochastic readings together, showing the contrast between stretched short-term conditions and still-negative momentum.
Volatility, Volume & Levels
Average true range, a measure of typical price movement, is S$0.14, or 2.5% of the share price, indicating moderate volatility. The latest volume of 5,992,742 shares was 1.6 times the 20-session average of 3,827,532. On-balance volume, which tracks whether volume tends to accompany rising or falling prices, is declining. That divergence is absent: trading activity and OBV both reinforce the bearish reading.
At S$5.68, the shares are testing 20-session support; a sustained break would put the S$5.50 three-month low in focus. If support holds, an initial recovery would still have to contend with resistance at S$6.08, followed by the S$6.22 three-month high. The technical bias is bearish, with three of seven bearish signals and no bullish signals; among them are the high-volume break below the 20-session low, the downside resolution of the Bollinger squeeze and falling OBV.
Technical Verdict: SELL
The technical verdict is SELL: the close below the lower Bollinger Band, negative MACD and falling OBV point to persistent selling pressure, despite an oversold stochastic. This verdict is invalidated if price breaks above S$6.08, the stated 20-session resistance.
- Entry range: S$5.68–S$5.71, around the latest close and lower Bollinger Band.
- Exit target: S$5.68 at 20-session support; below that, S$5.50, the three-month low.
- Stop-loss protection: S$5.89, the price plus 1.5 times ATR reference level.
In plain English, the indicators favor further weakness unless the shares recover above resistance.
| Data | Reading |
|---|---|
| Latest price | S$5.68 |
| One-day / five-day / one-month change | -3.57% / -2.91% / -3.73% |
| SMA20 / SMA50 | S$5.91 / S$5.94 |
| RSI / Stochastic %K, %D | 37.8 / 13.5, 38.5 |
| MACD / signal / histogram | -0.038 / -0.021 / -0.017 |
| 20-session support / resistance | S$5.68 / S$6.08 |
| Three-month high / low | S$6.22 / S$5.50 |
Summary Data Sembcorp
| Last price | 5.68 SGD |
| Change 1 day / 5 days / 1 month | -3.57% / -2.91% / -3.73% |
| Trend / MA-cross | downtrend / none |
| SMA20 / SMA50 | 5.91 / 5.94 |
| RSI (14) / Stochastic %K | 37.8 / 13.5 |
| Bollinger %B / ATR | -7% / 0.14 |
| Support / Resistance 20 days | 5.68 / 6.08 |
| Data as of | 6 November 2026 16:06 WIB |
Disclaimer: This technical analysis is generated automatically from exchange data and indicators calculated by JournalArta, for information and education only. The verdict and the entry, target and stop-loss levels are not investment advice or a solicitation to buy or sell any security. Investment decisions and their risks rest solely with the reader.
Track Sembcorp share price daily: live levels, support/resistance and our full Sembcorp analysis history.