China Mobile Share Price Falls 0.25% on Friday, Golden Cross Formed
Technical analysis of China Mobile stock on November 6, 2026: price 81.10 HKD, trend uptrend, RSI 62.5, support 77.10, resistance 81.30.

Why China Mobile is in focus today
- Fresh golden cross: SMA20 crossed above SMA50
- Uptrend confirmed (5-day change 1.37%)
Selected automatically from 72 HKEX (Hong Kong) stocks by a technical-signal score with daily weighted randomisation — not a recommendation.
Trend & Price Action
The stock remains above both its 20-day moving average, at HK$79.58, and its 50-day average, at HK$79.31. The shorter-term average crossed above the longer-term one two sessions before the latest session, a formation known as a golden cross and often read as evidence that recent price momentum is improving relative to the medium-term trend. It is not a guarantee of further gains: at this point, the share price is already near the top of its recent range. The 20-day average rose 0.55% over five days, while the five-day share-price gain confirms that the uptrend has made progress. The stock sits at 95% of its 20-day range, with support at HK$77.10 and resistance at HK$81.30. Its three-month high of HK$84.00 is the next broader reference if the near-term ceiling gives way. As shown in the chart, the price is above its moving averages and near the upper Bollinger band, while the band itself is narrowing. Bollinger bands track price volatility around a moving average; narrowing bands indicate a quieter period that can precede a larger move, but do not indicate its direction.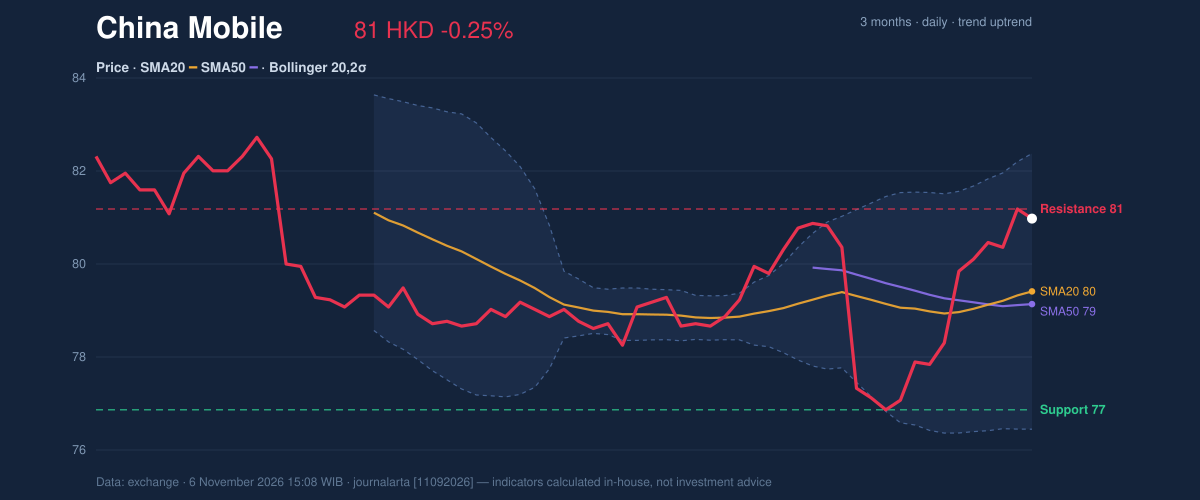
Oscillators & Momentum
Momentum measures are positive, though not uniformly comfortable. The MACD is positive at 0.320, with a 0.318 histogram, indicating that the faster trend remains stronger than its signal line. The RSI is 62.5, in neutral territory: it supports an improving trend without yet showing the elevated reading associated with a more broadly overbought market. The stochastic oscillator is the caution flag. Its %K of 87.2 and %D of 85.0 are overbought, suggesting the recent advance may have run ahead of its short-term pace. Such readings can persist in a rising market, but they make a pause or pullback more plausible if the share price cannot clear resistance.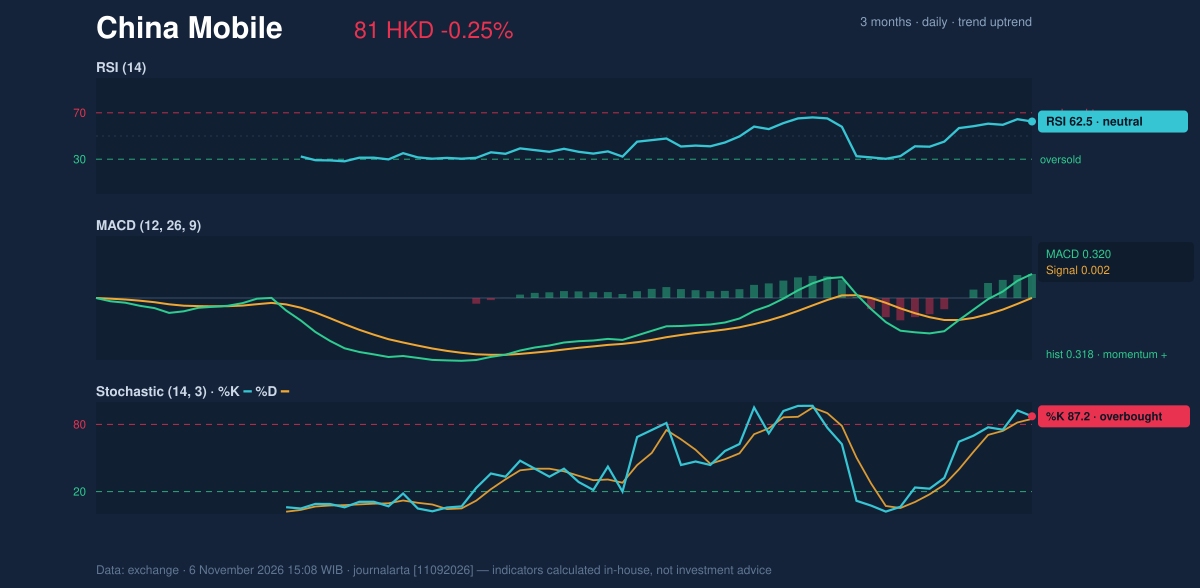
Volatility, Volume & Key Levels
The Bollinger reading is consistent with a stock testing the upper part of its recent range: %B is 76%, while the bands have narrowed to a 7.2% width. The upper band is HK$82.46 and the lower band HK$76.69. Average true range, a measure of typical price movement, is HK$1.22, or 1.5% of the share price, indicating moderate volatility. Trading volume was 15.6 million shares, about 0.9 times the 20-day average of 17.7 million. That is below normal rather than a strong surge of participation. However, OBV—the running total that adds volume on rising sessions and subtracts it on falling ones—is rising, offering supporting evidence that buying pressure has accumulated despite subdued latest-session turnover. The immediate test is HK$81.30 resistance. A break above it would put the HK$84.00 three-month high in view; failure to hold the area would leave the moving averages around HK$79.58 and HK$79.31 as nearer reference points, with HK$77.10 support marking a more substantial test of the uptrend.Technical Verdict: BUY
The technical bias is bullish, supported by the golden cross, price above both moving averages, and rising OBV. The positive MACD adds confirmation, although overbought stochastic readings and below-average volume argue against treating a breakout as established. The verdict is invalidated if the price falls below HK$77.10, the 20-day support. - Indicative entry range: HK$79.58–HK$81.30, between the 20-day average and near-term resistance. - Exit target: HK$84.00, the three-month high and next reference above HK$81.30. - Stop-loss protection: HK$77.10, below 20-day support. This technical verdict describes the chart signals, not a personal investment recommendation.Data Table
| Indicator | Reading |
|---|---|
| Last price | HK$81.10 |
| Change | 1 day: -0.25% | 5 days: +1.37% | 1 month: +2.14% |
| SMA20 / SMA50 | HK$79.58 / HK$79.31 |
| Golden cross | Formed two sessions before the latest session |
| RSI / Stochastic | 62.5 / %K 87.2, %D 85.0 |
| MACD / histogram | 0.320 / 0.318 |
| Support / resistance | HK$77.10 / HK$81.30 |
| Three-month high / low | HK$84.00 / HK$77.00 |
| Volume / 20-day average | 15,632,423 / 17,697,017 |
Summary Data China Mobile
| Last price | 81.10 HKD |
| Change 1 day / 5 days / 1 month | -0.25% / 1.37% / 2.14% |
| Trend / MA-cross | uptrend / golden |
| SMA20 / SMA50 | 79.58 / 79.31 |
| RSI (14) / Stochastic %K | 62.5 / 87.2 |
| Bollinger %B / ATR | 76% / 1.22 |
| Support / Resistance 20 days | 77.10 / 81.30 |
| Data as of | 6 November 2026 15:08 WIB |
Disclaimer: This technical analysis is generated automatically from exchange data and indicators calculated by JournalArta, for information and education only. The verdict and the entry, target and stop-loss levels are not investment advice or a solicitation to buy or sell any security. Investment decisions and their risks rest solely with the reader.
Track China Mobile share price daily: live levels, support/resistance and our full China Mobile analysis history.