ICBC Share Price Technicals: Rises 0.19% on Friday, Golden Cross Formed
Technical analysis of ICBC stock on November 6, 2026: price 7.95 HKD, trend uptrend, RSI 63.0, support 7.24, resistance 7.95.
Trend & Price Action
ICBC is trading above its 20-day average of HK$7.63 and 50-day average of HK$7.60. The 20-day average rose 1.05% over five days, indicating that the short-term trend is strengthening, not merely that the share price has moved higher. The golden cross formed four sessions before the latest session; that means the shorter-term average has moved above the longer-term one, a signal of improving trend structure rather than proof that gains will continue. The close at HK$7.95 is both a 20-session high and the 20-session resistance. That placement gives the market a clear test: a sustained move above this level would put the three-month high of HK$8.18 in view, while a failure to clear resistance could leave the stock consolidating below it. The price has advanced toward the upper end of its recent range, so the trend signal is constructive but the immediate room before the next reference level is limited.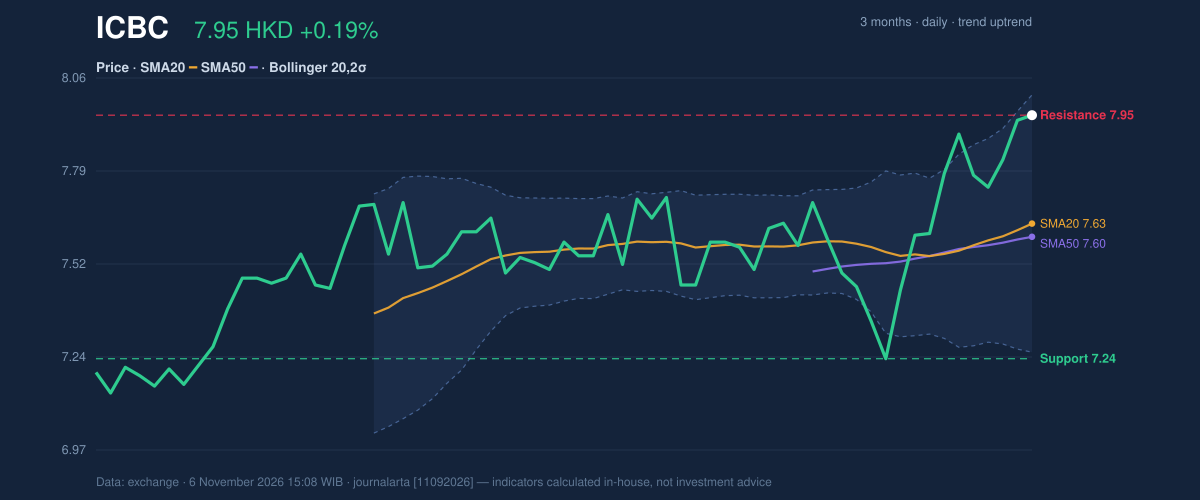
Oscillators & Momentum
Momentum indicators broadly support the rising trend without showing an extreme reading. The RSI is 63.0, in neutral territory; the Relative Strength Index measures the pace of recent gains and losses, and this reading does not indicate an overbought condition. The Stochastic is also neutral, with %K at 77.3 and %D at 72.6. It is elevated, but the supplied classification does not signal an overbought reading. The MACD is positive at 0.092, above its 0.050 signal line, with a positive 0.042 histogram. This supports the view that upward momentum remains intact. In combination with rising OBV, the indicators show trend and participation moving in the same direction, though the resistance level still needs to be overcome for that momentum to translate into a higher range.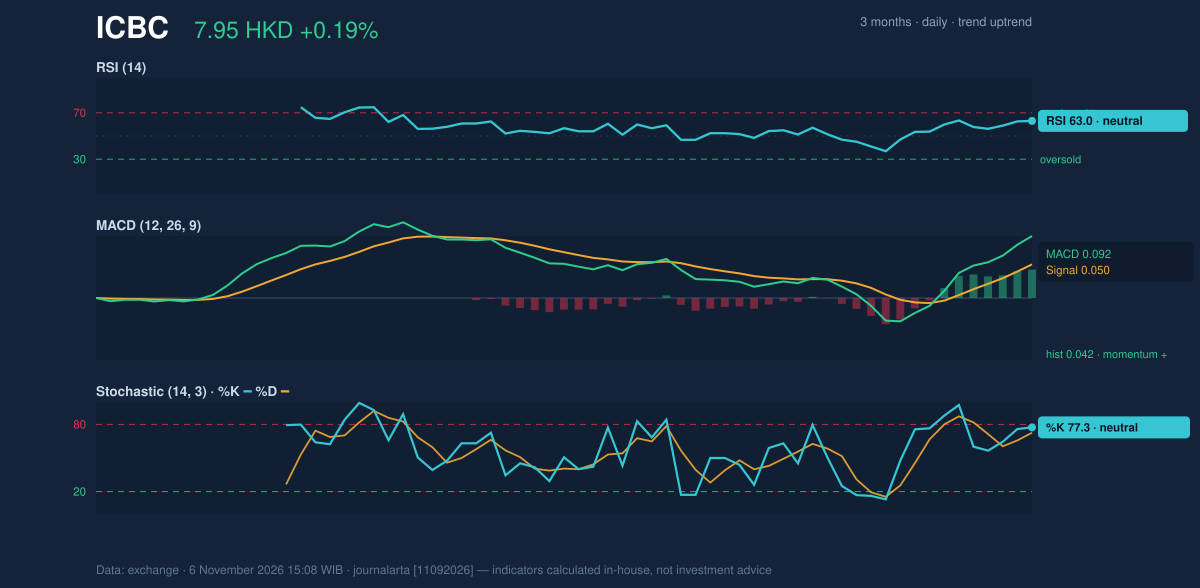
Volatility & Key Levels
The Bollinger Bands are at normal width, not compressed into a squeeze or expanding sharply. Still, the %B reading of 92% places the price near the upper band at HK$8.01, a sign that the share is trading close to the upper edge of its recent volatility range. The upper band is near the 20-session resistance, reinforcing the importance of a clean break rather than treating the latest high as confirmation on its own. Average True Range (ATR), a measure of typical price movement, stands at HK$0.23, or 2.9% of the share price—moderate volatility. The key downside references are support at HK$7.24 and the three-month low of HK$7.09. The price-minus-1.5-ATR reference is HK$7.60, close to the moving averages; a pullback toward that area would test whether the rising trend can hold before the deeper support comes into play.Technical Verdict: BUY
The technical bias is bullish, with three bullish signals and no bearish signals in the supplied assessment. The strongest reasons are the golden cross formed four sessions ago, the price holding above both moving averages with the 20-day average rising, and OBV moving higher. The main qualification is that the share is already at HK$7.95 resistance and near the upper Bollinger Band, so further progress depends on clearing that level. - Ideal entry range: HK$7.63–HK$7.95, anchored by the 20-day average and the 20-session resistance. - Exit target: HK$8.18, the three-month high and next resistance reference above the current 20-session ceiling. - Stop-loss protection: HK$7.24, below the 20-day support. The verdict is invalidated if the price falls below HK$7.24, which would break the stated 20-day support. In plain English, the trend currently favors further gains, but the stock must get past resistance and hold its support for that reading to remain intact.Data table
Why ICBC is in focus today
- Closed at a 20-day high (7.95)
- Fresh golden cross: SMA20 crossed above SMA50
Selected automatically from 72 HKEX (Hong Kong) stocks by a technical-signal score with daily weighted randomisation — not a recommendation.
| Last price | HK$7.95 |
| Change | 1 day: 0.19% | 5 days: 0.70% | 1 month: 5.09% |
| SMA20 / SMA50 | HK$7.63 / HK$7.60 |
| 20-session support / resistance | HK$7.24 / HK$7.95 |
| Three-month low / high | HK$7.09 / HK$8.18 |
| RSI / Stochastic | 63.0 / %K 77.3, %D 72.6 |
| MACD / signal / histogram | 0.092 / 0.050 / 0.042 |
| ATR(14) | HK$0.23 (2.9%) |
| Volume / 20-day average | 222,008,700 / 219,694,765 |
Summary Data ICBC
| Last price | 7.95 HKD |
| Change 1 day / 5 days / 1 month | 0.19% / 0.70% / 5.09% |
| Trend / MA-cross | uptrend / golden |
| SMA20 / SMA50 | 7.63 / 7.60 |
| RSI (14) / Stochastic %K | 63.0 / 77.3 |
| Bollinger %B / ATR | 92% / 0.23 |
| Support / Resistance 20 days | 7.24 / 7.95 |
| Data as of | 6 November 2026 15:08 WIB |
Disclaimer: This technical analysis is generated automatically from exchange data and indicators calculated by JournalArta, for information and education only. The verdict and the entry, target and stop-loss levels are not investment advice or a solicitation to buy or sell any security. Investment decisions and their risks rest solely with the reader.
Track ICBC share price daily: live levels, support/resistance and our full ICBC analysis history.