RSI Oversold, Ping An Stock Gains 0.45% on Tuesday
On October 27, 2026: price 48.68 HKD, trend downtrend, RSI 26.9, support 48.46, resistance 52.90. technical analysis of ping an stock.
By Elena Vance
October 27, 20264 min read
Advertisement
RSI Oversold, Ping An Stock Gains 0.45% on Tuesday
Why Ping An is in focus today
Trading near its 3-month low (48.28)
RSI(14) at 26.9 — oversold zone
Downtrend extending (5-day change -1.06%)
Selected automatically from 16 HKEX (Hong Kong) stocks by a technical-signal score with daily weighted randomisation — not a recommendation.
Ping An Insurance’s shares edged up 0.45% to HK$48.68 on Tuesday, October 27, 2026, but the rise came against a weaker short-term trend and a price close to its three-month low. For international investors, that tension matters: oversold readings can signal selling pressure is stretched, but they do not by themselves show that a decline has ended.
The stock sits near the bottom of its recent range. That is the signal to watch.
Advertisement
Trend & Price Action
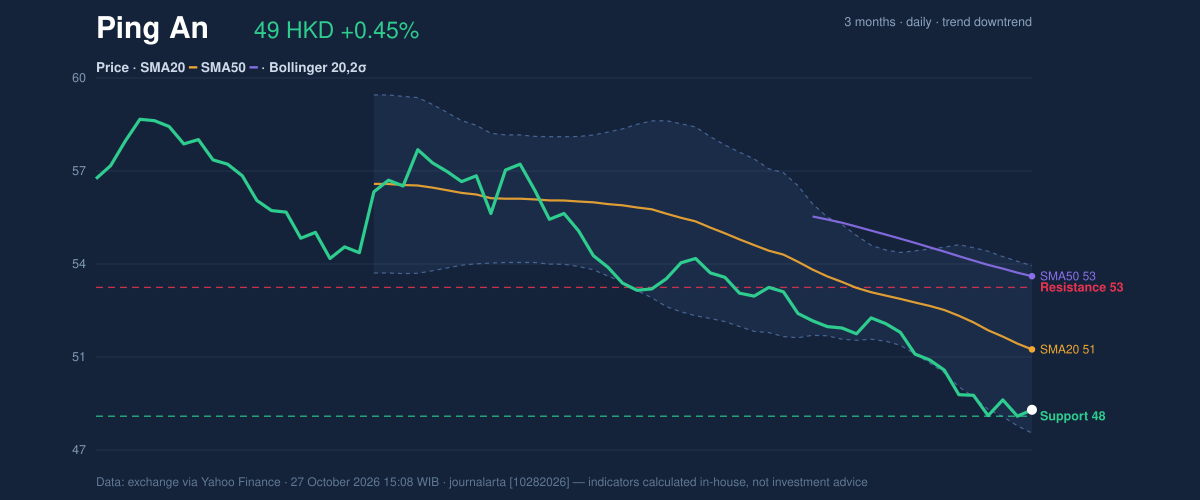
Ping An gained from a previous close of HK$48.46, yet remained down 1.06% over five days and 7.63% over one month, according to market data from the exchange. The latest price was only HK$0.40 above the three-month low of HK$48.28, leaving it near the lower edge of its recent trading range.
The broader price structure remains weak. At HK$48.68, the shares are below the 20-day average of HK$50.76 and the 50-day average of HK$53.29. A moving average smooths daily fluctuations to show the underlying direction; when price is below both, rallies have yet to reclaim those trend benchmarks. The 20-day average fell 2.23% over five days, reinforcing the downward slope. No new moving-average crossover was recorded.
The Bollinger reading also places the price close to the lower boundary. These bands map how far a price has moved from its recent average; Ping An’s %B of 14% means it is near the lower band, at HK$47.88, rather than the midpoint of HK$50.76. The band width is 11.4%, described as normal, so the data do not point to an unusually tight squeeze or an exceptional volatility expansion.
3-month price action chart of Ping An: price, SMA20/50, Bollinger, support & resistance. Data: exchange.
Advertisement
Oscillators & Momentum
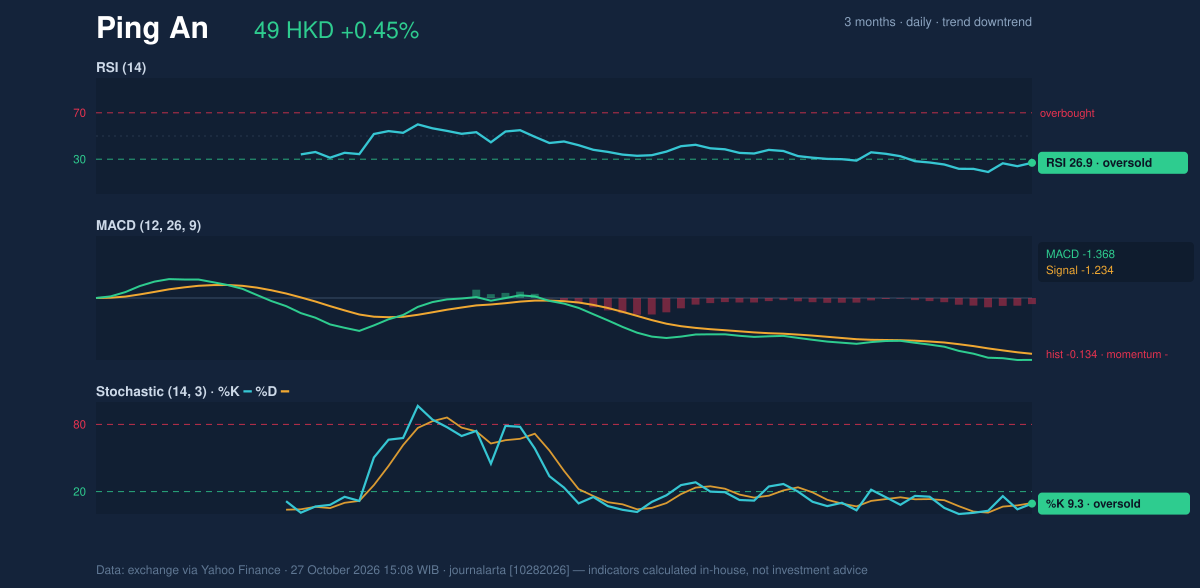
Short-term indicators show a market that is heavily sold but still moving downward. The RSI is 26.9, in oversold territory; RSI compares the size of recent gains and losses, and readings below 30 are commonly treated as a sign that selling has become intense. The Stochastic is also oversold, with %K at 9.3 and %D at 9.8, indicating that the latest close is near the lower end of its recent price range.
Those readings raise the possibility of a rebound, not confirmation of one. The MACD remains negative at -1.368, below its -1.234 signal line, with a -0.134 histogram. MACD tracks the relationship between moving averages; a negative reading and a histogram below zero indicate that downward momentum persists. The indicators therefore present a split message: selling looks stretched, but momentum has not turned positive.
Momentum chart of Ping An: RSI(14), MACD, Stochastic. Data: exchange.
Volatility, Volume & Key Levels
Trading volume was 29,804,303 shares, close to the 20-day average of 30,550,870, or 1.0 times normal. That is not a pronounced surge in participation that would independently confirm a reversal. On-balance volume, a running measure that weighs volume according to whether prices rise or fall, was declining—another sign that buying pressure has not yet taken control.
The 14-day average true range was HK$0.88, equal to 1.8% of the share price, pointing to moderate day-to-day volatility. The nearest levels are therefore especially relevant: support is HK$48.46, while resistance is HK$52.90. Support is a zone where demand has recently appeared; resistance is an area where selling has previously constrained advances. A sustained move above resistance would improve the short-term picture, while a fall through support would put the three-month low of HK$48.28 in focus. The lower Bollinger band at HK$47.88 is a further reference if selling extends.
Advertisement
Technical Verdict: HOLD (wait & see)
The technical verdict is HOLD (wait & see): oversold RSI and Stochastic readings leave room for a bounce, but negative MACD, falling moving averages and declining OBV do not yet confirm a turn. The verdict is invalidated if price breaks below HK$48.28, the three-month low.
Ideal Entry Range: HK$48.46–HK$50.76, bounded by near-term support and the 20-day average.
Exit Target (Target Price): HK$52.90, the 20-day resistance level.
Stop Loss: HK$47.88, the lower Bollinger band.
For non-traders, the indicators say the shares are deeply weakened, but a durable recovery has not yet been confirmed.
Data
Reading
Last price
HK$48.68
Daily / five-day / one-month change
+0.45% / -1.06% / -7.63%
20-day / 50-day average
HK$50.76 / HK$53.29
RSI / Stochastic
26.9 / %K 9.3, %D 9.8
MACD / signal / histogram
-1.368 / -1.234 / -0.134
Support / resistance
HK$48.46 / HK$52.90
Three-month high / low
HK$59.00 / HK$48.28
Summary Data Ping An
Last price
48.68 HKD
Change 1 day / 5 days / 1 month
0.45% / -1.06% / -7.63%
Trend / MA-cross
downtrend / none
SMA20 / SMA50
50.76 / 53.29
RSI (14) / Stochastic %K
26.9 / 9.3
Bollinger %B / ATR
14% / 0.88
Support / Resistance 20 days
48.46 / 52.90
Data as of
27 October 2026 15:08 WIB
Advertisement
Disclaimer: This technical analysis is generated automatically from exchange data (via Yahoo Finance) and indicators calculated by JournalArta, for information and education only. The verdict and the entry, target and stop-loss levels are not investment advice or a solicitation to buy or sell any security. Investment decisions and their risks rest solely with the reader.