OCBC Testing Support Level: Stock Gains 0.03% (October 27, 2026)
On October 27, 2026: price 28.96 SGD, trend downtrend, RSI 34.6, support 28.80, resistance 32.20. technical analysis of ocbc stock.
By Elena Vance
October 27, 20264 min read
Advertisement
OCBC Testing Support Level
Why OCBC is in focus today
Trading near its 3-month low (28.51)
Selected automatically from 16 SGX (Singapore) stocks by a technical-signal score with daily weighted randomisation — not a recommendation.
OCBC Bank’s Singapore-listed shares closed at S$28.96 on Tuesday, October 27, 2026, just above the 20-session support at S$28.80 and near the three-month low of S$28.51. That proximity to the bottom of the recent range puts the stock on watch, but the broader signals remain weak: the share price is below both its 20- and 50-day averages, and trading volume was thin.
Trend & Price Action
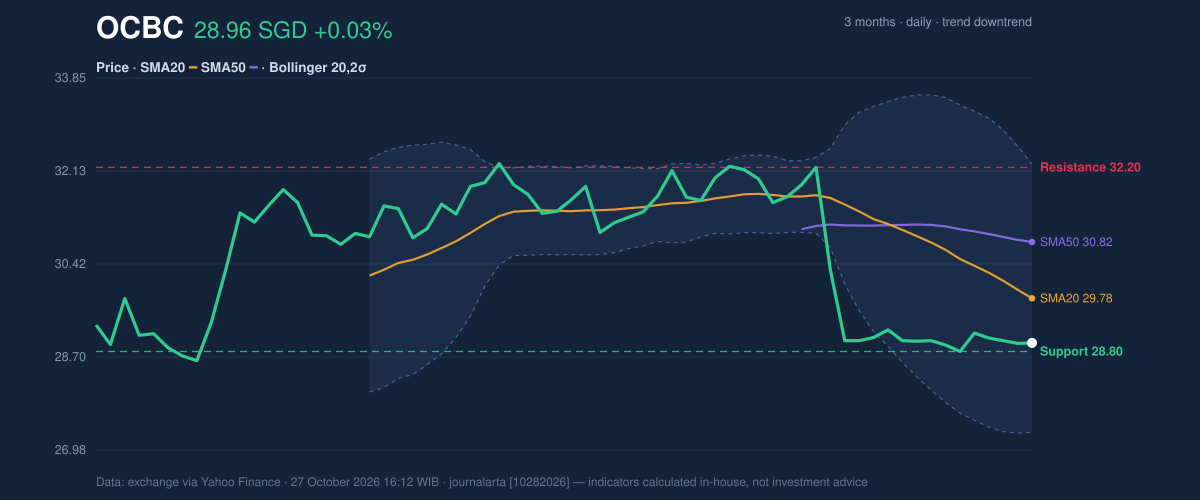
The shares edged up 0.03% in the latest session and gained 0.56% over five days, but are down 9.95% over one month. That split suggests a brief pause in a larger decline rather than evidence of a durable recovery. The 20-day average has fallen 2.38% over five days, and at S$29.78 it sits above the latest price; the 50-day average is higher still, at S$30.82. With no new moving-average crossover, the trend has not yet produced a technical signal of reversal.
Price is near the lower end of its three-month range, which runs from S$28.51 to S$32.57. The 20-session support at S$28.80 is an immediate test: holding near this area could help stabilize the decline, while a break beneath it would put the three-month low in focus. The price remains below both moving averages, keeping the trend bearish despite the small recent gains.3-month price action chart of OCBC: price, SMA20/50, Bollinger, support & resistance. Data: exchange.
Advertisement
Oscillators & Momentum
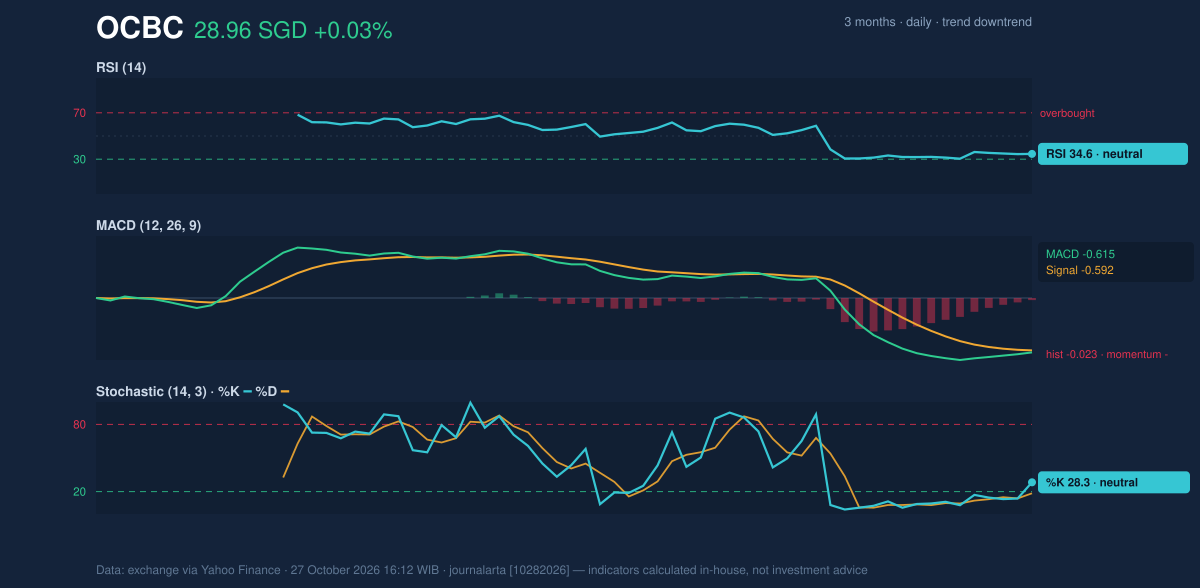
The momentum indicators show weakness, but not a clear oversold signal. RSI is 34.6, labelled neutral in the data, while Stochastic %K at 28.3 and %D at 18.5 are also neutral. Their low readings indicate subdued buying momentum; without a turn higher, they do not establish that the decline has ended. RSI and Stochastic remain weak-to-neutral, rather than confirming a rebound.
MACD is -0.615 against a signal line of -0.592, leaving a negative histogram of -0.023. MACD compares shorter- and longer-term price momentum; a negative reading means the shorter-term trend remains weaker. The narrow gap between the two lines may point to limited recent change in momentum, but the negative histogram still tilts the signal lower.
Momentum chart of OCBC: RSI(14), MACD, Stochastic. Data: exchange.
Volatility & Volume
The Bollinger Bands span S$27.31 to S$32.26, with the middle band at S$29.78. At 33% of the way from the lower to the upper band, the price sits in the lower portion of its recent volatility range. The 16.6% band width is classified as normal, not a squeeze that would signal unusually compressed trading. The lower-band position reflects price weakness, but the bands do not point to an exceptional volatility breakout.
Average True Range is S$0.52, or 1.8% of the share price, indicating moderate day-to-day movement. Volume, however, was only 3,887,840 shares, about half the 20-session average of 8,338,020, while OBV was falling. OBV tracks whether volume is accumulating on rising sessions or distributing on falling ones. Its decline, alongside thin turnover, offers little evidence that buyers are stepping in with conviction.
Advertisement
Key Levels & Scenarios
The S$28.80 support and S$32.20 resistance define the near-term range in the data, with the latest price near its lower end. A sustained hold above support could allow a test of the S$29.78 20-day average; recovering that average would be an early sign of improving price structure, though S$30.82 remains a higher hurdle. If S$28.80 fails, the three-month low at S$28.51 becomes the next reference point. A move through resistance at S$32.20 would be needed to challenge the prevailing downtrend.
Technical Verdict: HOLD (wait & see)
HOLD (wait & see) best reflects the mixed setup: the shares are close to three-month support, but remain below falling short-term averages; MACD and OBV are still negative; and low volume leaves the small five-day gain without strong confirmation. This is a technical reading, not an investment recommendation.
- Ideal Entry Range: S$28.80–S$29.78, bounded by 20-session support and the 20-day average.
- Exit Target (Target Price): S$32.20, the 20-session resistance.
- Stop Loss protection: S$28.51, the three-month low.
- Invalidation: This verdict is invalidated if the price breaks below S$28.51.
In plain English, the chart shows a share price near support, but not yet enough evidence that buyers have reversed the broader decline.
Advertisement
Summary Data OCBC
Last price
28.96 SGD
Change 1 day / 5 days / 1 month
0.03% / 0.56% / -9.95%
Trend / MA-cross
downtrend / none
SMA20 / SMA50
29.78 / 30.82
RSI (14) / Stochastic %K
34.6 / 28.3
Bollinger %B / ATR
33% / 0.52
Support / Resistance 20 days
28.80 / 32.20
Data as of
27 October 2026 16:12 WIB
Disclaimer: This technical analysis is generated automatically from exchange data (via Yahoo Finance) and indicators calculated by JournalArta, for information and education only. The verdict and the entry, target and stop-loss levels are not investment advice or a solicitation to buy or sell any security. Investment decisions and their risks rest solely with the reader.