On October 27, 2026: price 0.60 SGD, trend downtrend, RSI 29.7, support 0.60, resistance 0.63. technical analysis of genting singapore stock.
By Elena Vance
October 27, 20264 min read
Advertisement
Genting Singapore Stock Analysis
Why Genting Singapore is in focus today
Closed at a 20-day low (0.60)
Trading near its 3-month low (0.58)
RSI(14) at 29.7 — oversold zone
Downtrend extending (5-day change -1.65%)
Selected automatically from 16 SGX (Singapore) stocks by a technical-signal score with daily weighted randomisation — not a recommendation.
Genting Singapore closed at S$0.60 on Tuesday, October 27, 2026, at its 20-session low and close to the three-month bottom of S$0.58. The stock is oversold by one momentum measure, but the broader technical picture remains weak: price sits below both moving averages, selling pressure is still evident, and the trading range has narrowed. That tension makes the shares worth watching—not because a rebound is confirmed, but because a compressed market near its lows can be vulnerable to a decisive move either way.
Advertisement
Trend & Price Action
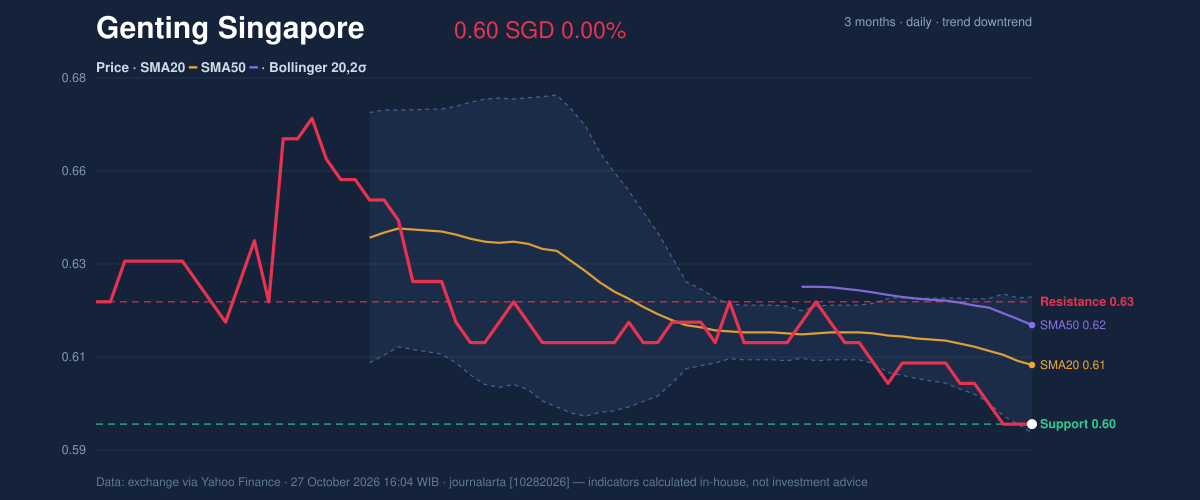
The shares were unchanged on the session, but that pause followed a 1.65% decline over five days and a 3.25% fall over one month. Price at S$0.60 is below the 20-day simple moving average, or SMA, at S$0.61 and the 50-day average at S$0.62. The 20-day average itself fell 0.85% over five days, indicating that the short-term trend is weakening rather than stabilising.
There is no new moving-average crossover. That means the chart has not produced a fresh signal that the shorter trend has turned decisively upward or downward; instead, the evidence comes from price remaining under both averages. The 20-session range runs from S$0.60 support to S$0.63 resistance, placing the latest close at the bottom of that range. The three-month high and low are S$0.68 and S$0.58 respectively, so the current price is also near the longer-period floor.
As shown in the chart, the Bollinger Bands—a measure of price dispersion around a moving average—span S$0.59 to S$0.63. The S$0.60 close sits near the lower band, while the 7% position within the bands confirms that price is clustered toward the downside. Their 5.5% width is described as a squeeze: the bands have narrowed, signalling subdued recent movement and the potential for a larger move, but not its direction.
3-month price action chart of Genting Singapore: price, SMA20/50, Bollinger, support & resistance. Data: exchange.
Advertisement
Oscillators & Momentum
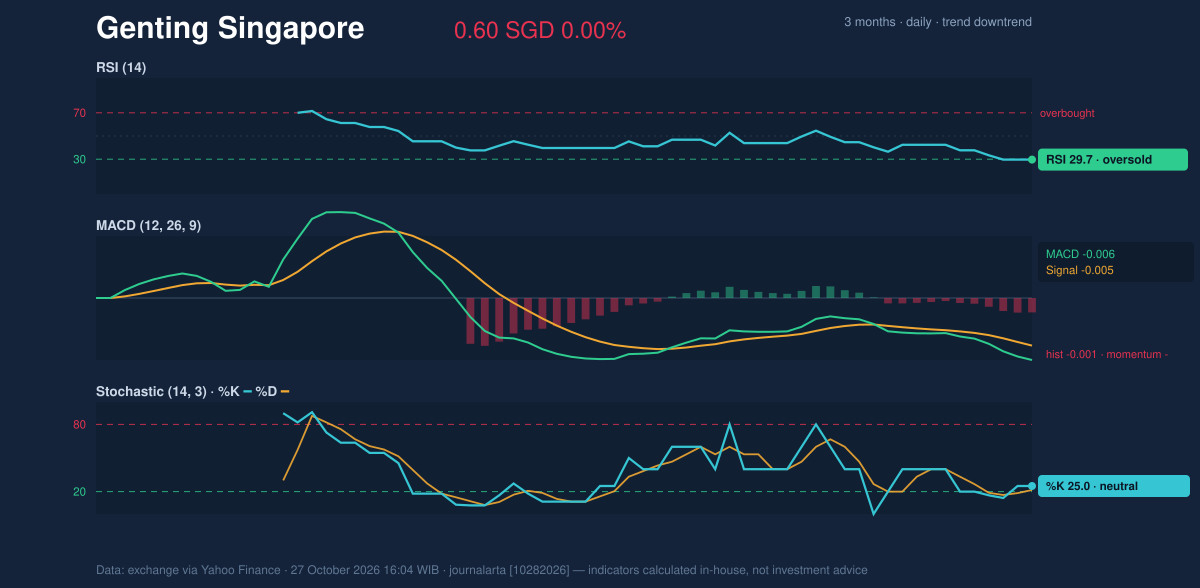
The RSI at 29.7 is in oversold territory, meaning recent losses have been unusually persistent by this indicator’s scale. That can precede a bounce, but it does not establish that one has begun. The Stochastic reading is more restrained: %K at 25.0 and %D at 21.4 are neutral, offering no clear reversal confirmation.
The MACD is negative, at -0.006 against a signal line of -0.005, with a -0.001 histogram. In plain terms, the measured momentum remains slightly weaker than its comparison line, consistent with the downtrend. The combination matters: RSI points to an extended decline, while MACD has yet to confirm a change in direction. A move higher would carry more technical weight if momentum indicators improved alongside price.
Momentum chart of Genting Singapore: RSI(14), MACD, Stochastic. Data: exchange.
Volatility, Volume & Key Levels
Average true range, or ATR, is S$0.01, equal to 1.9% of the share price and indicating moderate volatility. That is meaningful against the narrow S$0.60–S$0.63 short-term range: even a modest move could test one of its boundaries. The band squeeze adds to the prospect of expansion, although the chart alone cannot say whether a breakout would be upward or downward.
Volume was 13,222,400 shares, about 0.8 times the 20-session average of 17,567,230, while on-balance volume (OBV), which tracks whether volume is accumulating on rising or falling sessions, declined. The lighter turnover suggests the latest low was not accompanied by above-average participation, but falling OBV still points to distribution pressure rather than accumulation.
The immediate test is S$0.60 support. If it gives way, the three-month low at S$0.58 becomes the next reference point in the supplied data. A hold at S$0.60 could allow a rebound attempt, but S$0.61 at the 20-day average and S$0.63 resistance mark successive hurdles. The compressed bands and oversold RSI make a bounce plausible; the falling averages, negative MACD and declining OBV keep that possibility unconfirmed.
Advertisement
Technical Verdict: HOLD (wait & see)
The indicators support a neutral, cautious reading rather than a directional call. RSI is oversold, but the MACD remains negative; price is below the SMA20 and SMA50, and OBV is falling. The verdict is invalidated on the downside if price falls below S$0.58, the three-month low.
- Ideal entry range: S$0.59–S$0.60, around the lower Bollinger Band and 20-session support; this is a technical reference, not a recommendation.
- Exit target: S$0.63, the upper Bollinger Band and 20-session resistance.
- Stop-loss protection: S$0.58, the three-month low.
In plain English, the chart shows a share price under pressure that may be stretched, but has not yet demonstrated a reliable turn higher.
Data: Yahoo Finance, market data via the exchange, as of the Tuesday, October 27, 2026 session.
Summary Data Genting Singapore
Last price
0.60 SGD
Change 1 day / 5 days / 1 month
0.00% / -1.65% / -3.25%
Trend / MA-cross
downtrend / none
SMA20 / SMA50
0.61 / 0.62
RSI (14) / Stochastic %K
29.7 / 25.0
Bollinger %B / ATR
7% / 0.01
Support / Resistance 20 days
0.60 / 0.63
Data as of
27 October 2026 16:04 WIB
Advertisement
Disclaimer: This technical analysis is generated automatically from exchange data (via Yahoo Finance) and indicators calculated by JournalArta, for information and education only. The verdict and the entry, target and stop-loss levels are not investment advice or a solicitation to buy or sell any security. Investment decisions and their risks rest solely with the reader.