On October 27, 2026: price 10.00 HKD, trend uptrend, RSI 61.0, support 9.51, resistance 10.00. technical analysis of ccb stock.
By Elena Vance
October 27, 20264 min read
Advertisement
CCB Testing Key Resistance
Why CCB is in focus today
Closed at a 20-day high (10.00)
Trading near its 3-month high (10.04)
MACD histogram has just turned positive
Uptrend confirmed (5-day change 2.25%)
Selected automatically from 16 HKEX (Hong Kong) stocks by a technical-signal score with daily weighted randomisation — not a recommendation.
China Construction Bank’s Hong Kong shares closed at HK$10.00 on Tuesday, October 27, at their highest level in 20 trading days and just below the three-month high of HK$10.04. The breakout attempt matters to international investors because it is backed by heavier-than-usual turnover and a positive MACD histogram, though short-term momentum is stretched and the price is pressing against resistance.
Advertisement
Trend & Price Action
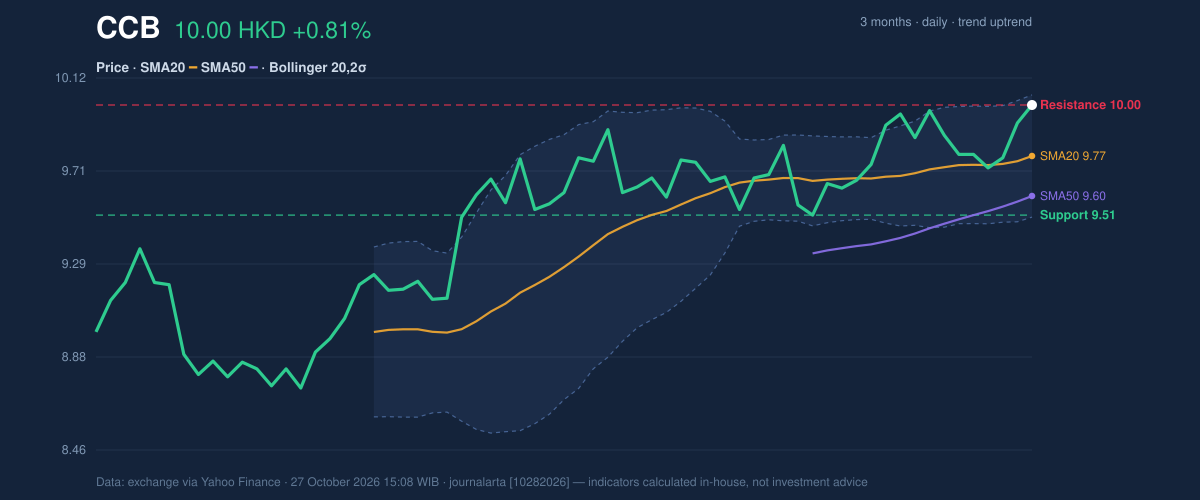
The stock gained 0.81% in one day, 2.25% over five days and 4.88% over one month, according to market data from the exchange. It closed above both its 20-day simple moving average (SMA), at HK$9.77, and its 50-day average, at HK$9.60. A moving average smooths daily price moves; trading above both generally indicates that the prevailing trend is upward, rather than a single-session spike.
The 20-day average rose 0.42% over five days, providing further evidence that the short-term trend is strengthening. There was no new moving-average crossover, so the signal comes from the price’s position above the averages, not from a fresh cross between them. The close also reached the top of the 20-day range and sat near the three-month peak, leaving little room before a notable overhead level.
3-month price action chart of CCB: price, SMA20/50, Bollinger, support & resistance. Data: exchange.
The upper Bollinger Band stood at HK$10.04, with the middle band at HK$9.77 and the lower band at HK$9.50. Bollinger Bands frame price movement around an average; their 5.6% narrowing points to a squeeze, a period of compressed volatility that can precede a larger move but does not, by itself, determine its direction. With the share at 92% of the band’s range, it is already close to the upper boundary.
Advertisement
Oscillators & Momentum
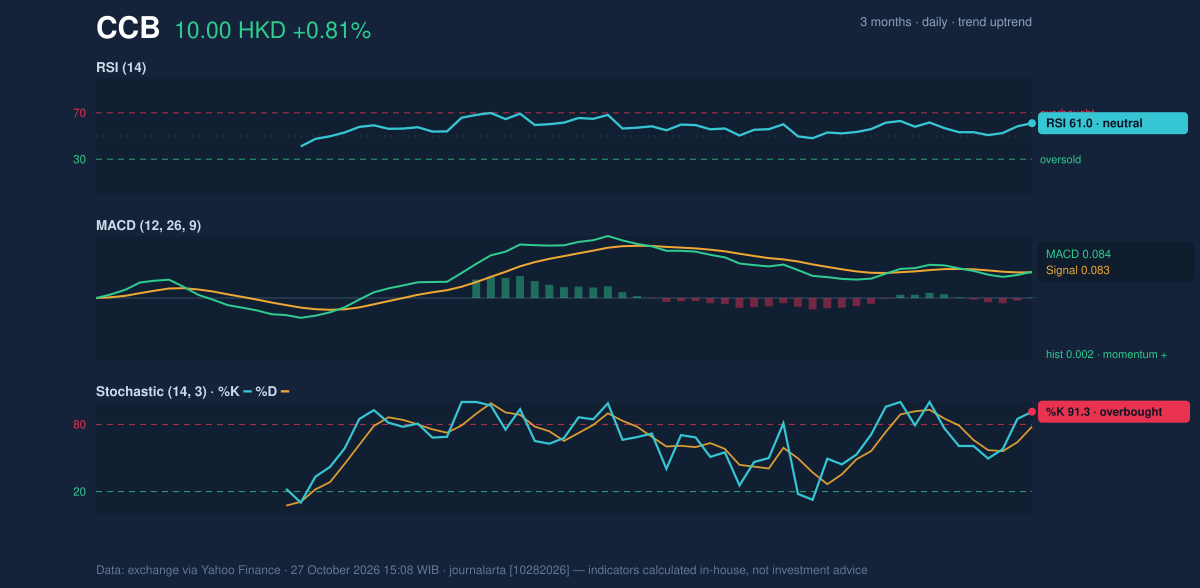
Momentum is positive, but not uniformly so. The RSI is 61.0, a neutral reading that does not yet show the same degree of strain as the faster stochastic indicator. The stochastic readings, %K at 91.3 and %D at 78.1, are overbought; that means recent gains have been rapid relative to the indicator’s lookback period, raising the risk of a pause or pullback rather than proving that a reversal has begun.
Momentum chart of CCB: RSI(14), MACD, Stochastic. Data: exchange.
The MACD line was 0.084 against a signal line of 0.083, leaving a small positive histogram of 0.002. The histogram has only just turned positive, so it adds confirmation to the rising trend but remains a narrow margin: momentum is improving, not yet decisively separated from its signal line. The combination of an overbought stochastic and a newly positive MACD captures the tension in the setup—buyers have regained momentum, while the near-term move may be crowded.
Volatility, Volume & Key Levels
Trading volume reached 265,181,822 shares, or 1.4 times the 20-day average, and on-balance volume (OBV), which tracks whether volume accompanies gains or losses, was rising. That participation supports the move more convincingly than a thin-volume advance would. The average true range (ATR) was HK$0.18, equivalent to 1.8% of the share price, indicating moderate day-to-day volatility rather than unusually wide swings.
The immediate resistance is HK$10.00, with the three-month high and upper Bollinger Band both at HK$10.04. A sustained move above that zone would put the range ceiling behind the stock; failure to clear it could leave price vulnerable to a retreat toward the HK$9.77 20-day average. The more distant 20-day support is HK$9.51, close to the lower Bollinger Band at HK$9.50. A break below that support would weaken the near-term upward structure.
Advertisement
Technical Verdict: HOLD (wait & see)
The technical picture leans upward, but price is testing resistance while the stochastic is overbought. The verdict rests on three signals: the share is above rising short- and medium-term averages; volume is 1.4 times its 20-day norm with OBV rising; and the MACD histogram has turned positive. Against those positives, the price is at the 20-day range ceiling and near the three-month high, while Bollinger Bands are compressed. The verdict is invalidated if price falls below HK$9.51, the 20-day support.
- Ideal entry range: HK$9.77–HK$10.00, anchored to the 20-day average and current resistance.
- Exit target: HK$10.04, the three-month high and upper Bollinger Band.
- Stop-loss protection: HK$9.50, the lower Bollinger Band, just below the stated support.
For non-traders, HOLD means the indicators are constructive but do not yet show whether the stock can clear its nearby ceiling without first cooling off.
Disclaimer: This technical analysis is generated automatically from exchange data (via Yahoo Finance) and indicators calculated by JournalArta, for information and education only. The verdict and the entry, target and stop-loss levels are not investment advice or a solicitation to buy or sell any security. Investment decisions and their risks rest solely with the reader.