WMT Stock Technicals: Gains 0.33% on Monday, RSI Overbought
On October 26, 2026: price 120.29 USD, trend uptrend, RSI 70.4, support 103.92, resistance 121.12. technical analysis of wmt stock.
By Alistair Sterling
October 27, 20264 min read
Advertisement
WMT Stock Technicals
Why WMT is in focus today
Trading near its 3-month high (122.40)
RSI(14) at 70.4 — overbought zone
Uptrend confirmed (5-day change 1.34%)
Selected automatically from 30 NYSE (US) stocks by a technical-signal score with daily weighted randomisation — not a recommendation.
Walmart shares rose 0.33% to $120.29 in the latest session, putting the retailer close to its three-month high even as momentum readings enter overbought territory. For international investors, the tension matters: the chart shows a sustained advance, but the price is nearing resistance while trading volume remains below its recent average.
The data, sourced from exchange records as of October 27, 2026, show a 1.34% gain over five trading days and a 10.63% rise over one month. That makes Walmart worth watching today: its uptrend is intact, yet several indicators suggest the pace may be difficult to sustain without a pause. Technical signals describe price behavior, not the company’s underlying business performance.
Advertisement
Trend & Price Action
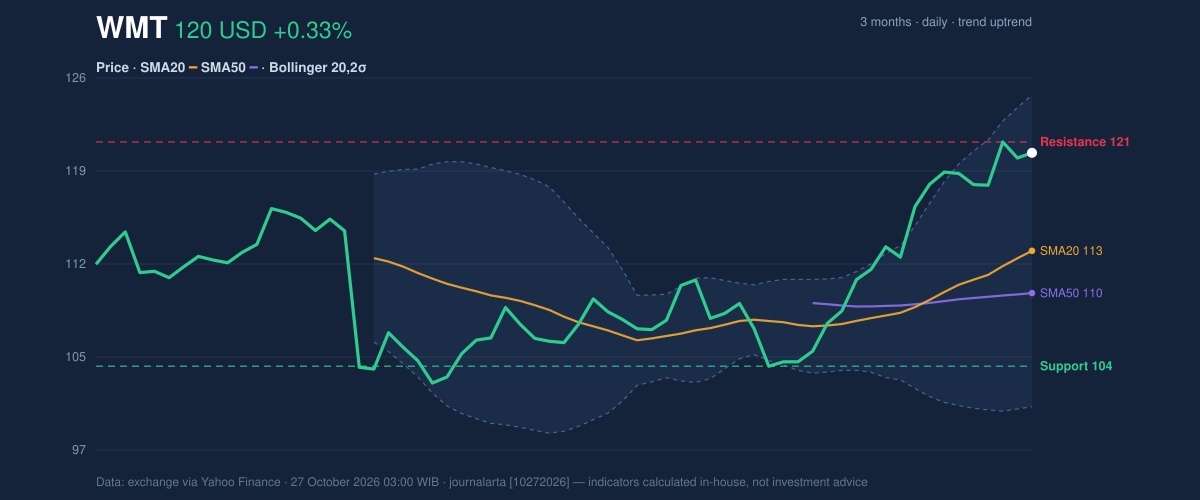
Walmart trades above its 20-day simple moving average (SMA), at $112.77, and its 50-day SMA, at $109.53. A simple moving average smooths recent prices to help show direction; the shorter average sitting above the longer one is consistent with an advancing trend, although there has been no new moving-average crossover. The 20-day average’s 2.36% rise over five days indicates that the trend itself is also steepening.
The share price is at 95% of its 20-trading-day range, with resistance at $121.12 and support at $103.92. Its three-month high of $122.40 is close enough to frame the immediate test: a sustained move through resistance would put that high in focus, while a rejection could leave the stock vulnerable to a retreat toward nearer trend measures.
As shown in the chart, the price is approaching the upper Bollinger Band at $124.73, while the band midpoint is $112.77. Bollinger Bands widen as price swings increase; the 21.2% width signals elevated volatility, not a forecast of direction.
3-month price action chart of WMT: price, SMA20/50, Bollinger, support & resistance. Data: exchange.
Advertisement
Oscillators & Momentum
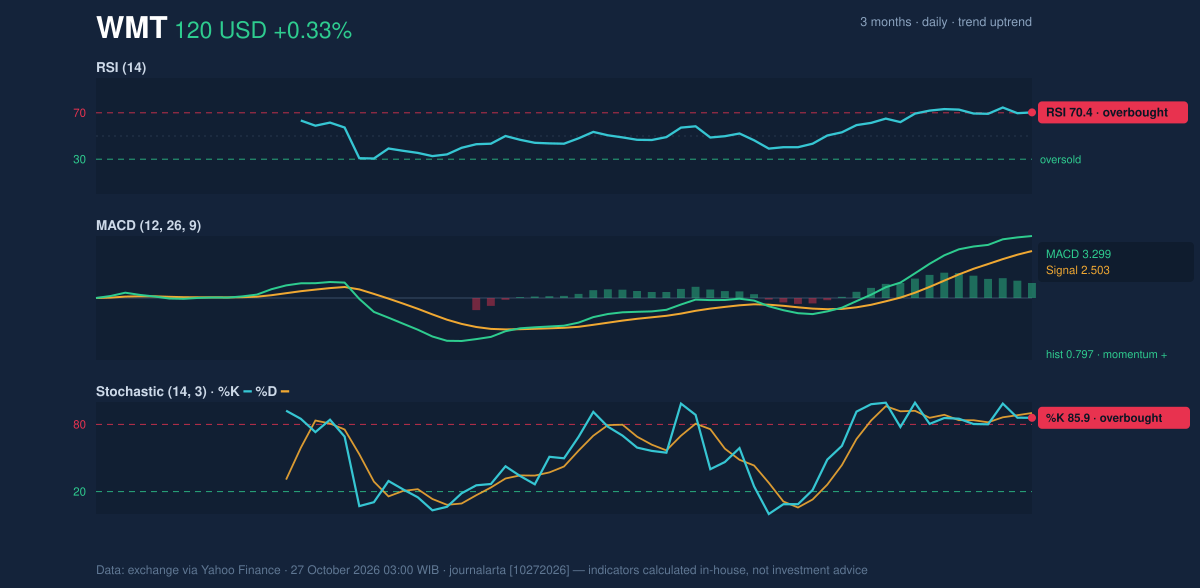
The momentum picture is positive, but stretched. The RSI is 70.4, in overbought territory; RSI compares recent gains and losses, and readings above 70 are commonly treated as a warning that prices may have risen quickly. It does not, by itself, establish that a reversal is under way. The Stochastic reading is also overbought, with %K at 85.9 and %D at 90.2, reinforcing the signal that the recent advance has been strong.
The MACD remains positive at 3.299, above its 2.503 signal line, with a positive 0.797 histogram. This indicates that upward momentum is still in place, even as the other oscillators flag a crowded, extended move. As shown in the chart, the contrast is between positive trend confirmation from MACD and overbought readings from RSI and Stochastic—not a settled reversal signal.
Momentum chart of WMT: RSI(14), MACD, Stochastic. Data: exchange.
Volatility, Volume & Levels
The average true range (ATR), a measure of typical price movement, is $2.57, or 2.1% of the share price, pointing to moderate daily volatility. The wider Bollinger Bands suggest larger swings than a quieter market, so resistance tests or pullbacks may be more pronounced.
Trading volume was 16,170,200 shares, about 0.8 times the 20-day average of 21,204,655. That lighter participation tempers the strength of the latest advance: the price has risen, but the session did not bring unusually broad trading activity. On-balance volume (OBV), which combines volume with price direction, is rising, offering a more supportive sign that buying pressure has accumulated over time.
The key nearby ceiling is $121.12; a clear move above it would put the three-month high of $122.40 in view. If the price fails there, the rising SMA20 at $112.77 is a nearer reference point, with the 20-day support at $103.92 marking a deeper level to watch. These are conditional chart scenarios, not predictions.
Advertisement
Technical Verdict: HOLD (wait & see)
HOLD (wait & see) is the clearest technical reading: the price remains above both moving averages, MACD and OBV are supportive, but RSI and Stochastic are overbought and the share is close to resistance on below-average volume. The verdict is invalidated if the price falls below $103.92, the stated 20-day support.
Ideal entry range: $112.77–$121.12, bounded by the SMA20 and nearby resistance; this is a chart-based reference, not a trade instruction.
Exit target: $122.40, the three-month high and the next stated price level above resistance.
Stop-loss protection level: $103.92, the stated 20-day support.
In plain English, the trend is rising, but the price is close to a ceiling and momentum gauges warn that a pause is possible.
Technical data
Reading
Last price
$120.29
SMA20 / SMA50
$112.77 / $109.53
RSI(14)
70.4 — overbought
Stochastic %K / %D
85.9 / 90.2 — overbought
MACD / signal / histogram
3.299 / 2.503 / 0.797
Support / resistance (20 trading days)
$103.92 / $121.12
Three-month high / low
$122.40 / $102.15
Advertisement
Summary Data WMT
Last price
120.29 USD
Change 1 day / 5 days / 1 month
0.33% / 1.34% / 10.63%
Trend / MA-cross
uptrend / none
SMA20 / SMA50
112.77 / 109.53
RSI (14) / Stochastic %K
70.4 / 85.9
Bollinger %B / ATR
81% / 2.57
Support / Resistance 20 days
103.92 / 121.12
Data as of
27 October 2026 03:00 WIB
Disclaimer: This technical analysis is generated automatically from exchange data (via Yahoo Finance) and indicators calculated by JournalArta, for information and education only. The verdict and the entry, target and stop-loss levels are not investment advice or a solicitation to buy or sell any security. Investment decisions and their risks rest solely with the reader.