UNH Stock Technicals: Drops 1.77% on Monday, Golden Cross Formed
On October 26, 2026: price 410.70 USD, trend uptrend, RSI 59.9, support 365.20, resistance 424.98. technical analysis of unh stock.
By Alistair Sterling
October 27, 20264 min read
Advertisement
UNH Stock Technicals
UnitedHealth Group fell 1.77% on the NYSE to US$410.70 on October 27, despite a newly formed golden cross that puts its 20-day average above its 50-day average. The signal makes the stock worth watching, but the latest decline and below-average trading volume leave open whether buyers are ready to extend the advance.
The price data are from the exchange, as of 03:00 WIB. UNH is still up 0.94% over five trading days and 8.70% over one month, so the daily drop has not erased its broader recent gains.
Trend & Price Action
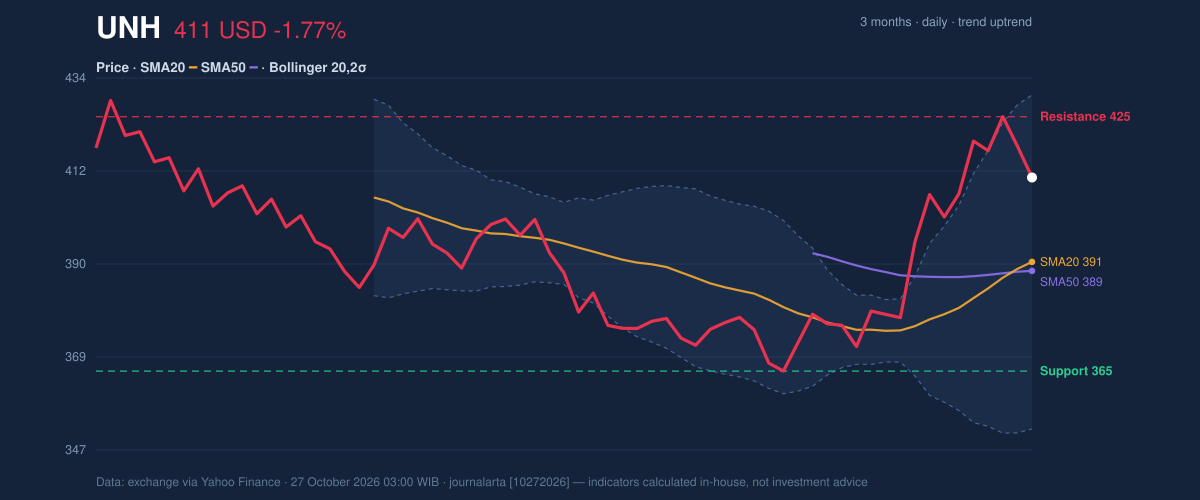
UNH trades above its SMA20 of US$390.86 and SMA50 of US$388.75. The 20-day average has crossed above the 50-day average—a golden cross, often read as evidence that shorter-term momentum is improving relative to the medium-term trend. Its 2.85% rise over five days adds support to that interpretation.
But a positive moving-average signal is not a guarantee of further gains. The shares sit at 76% of their 20-trading-day range, closer to resistance at US$424.98 than to support at US$365.20. The three-month high of US$431.68 is also nearby in market terms, making the upper part of the range a test of whether demand can absorb profit-taking.
As shown in the chart, the price is above both moving averages and the Bollinger midpoint, while approaching the upper end of its recent range.
3-month price action chart of UNH: price, SMA20/50, Bollinger, support & resistance. Data: exchange.
Advertisement
Oscillators & Momentum
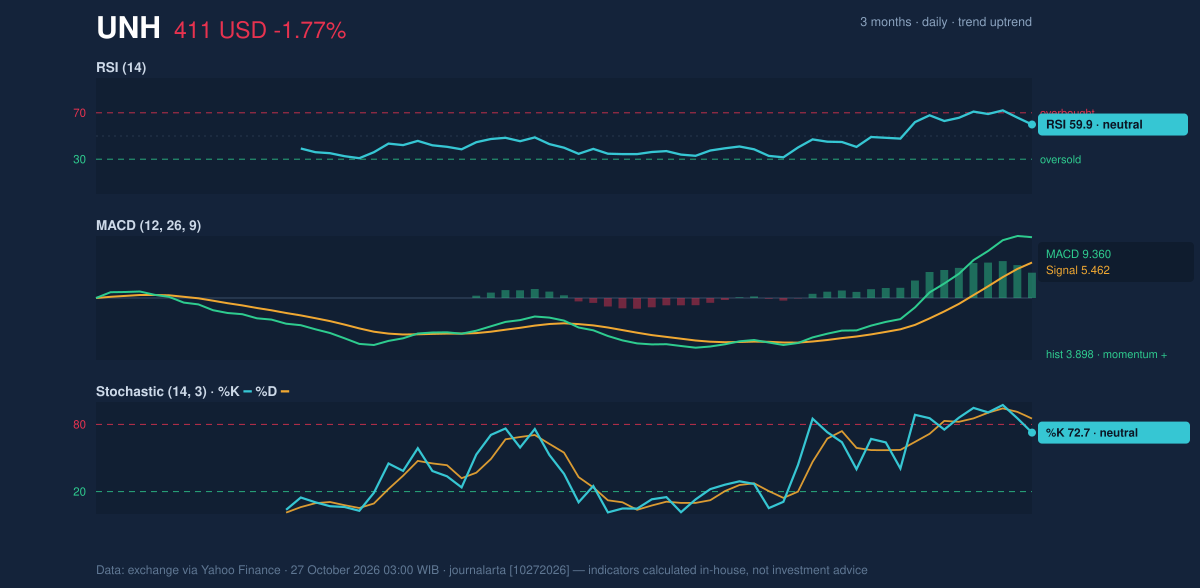
Momentum indicators broadly support the rising trend, though they do not show a uniformly strong confirmation. The RSI is 59.9, in neutral territory: it suggests positive but not extreme momentum, rather than a market already pushed into an overbought condition. RSI measures the speed and scale of recent price moves.
The Stochastic is also classified as neutral, with %K at 72.7 and %D at 85.1. Because %K is below %D, the pair points to some near-term loss of pace even as the wider trend remains constructive. The indicator compares a closing price with its recent trading range.
By contrast, MACD is positive: its 9.360 reading is above the 5.462 signal line, with a positive 3.898 histogram. That combination indicates upward momentum remains in place. As shown in the chart, the distinction is between a still-positive MACD trend and the less forceful message from the Stochastic.
Momentum chart of UNH: RSI(14), MACD, Stochastic. Data: exchange.
Volatility, Volume & Key Levels
UNH’s Bollinger bands are widening, with a 20.1% band width, signalling higher volatility. The price is at 75% of the band range: above the US$390.86 midpoint, but below the upper band at US$430.11. This is consistent with a strong recent climb, while the widening bands warn that price swings may remain pronounced. The average true range of US$13.50, or 3.3% of the share price, likewise indicates meaningful day-to-day movement.
Participation offers a mixed signal. Latest volume was 4,583,600 shares, about 0.8 times the 20-day average of 6,042,635. That means the latest decline came on lighter-than-usual trading, not a surge in activity. Meanwhile, rising OBV—an indicator that uses volume alongside price direction—suggests accumulated buying pressure has not yet reversed.
A sustained move above US$424.98 resistance would put the three-month high of US$431.68 and upper Bollinger band of US$430.11 in focus. Failure to hold above the moving averages, particularly US$388.75 at the SMA50, would weaken the golden-cross signal; the wider 20-day support remains US$365.20.
Advertisement
Technical Verdict: HOLD (wait & see)
The indicators lean positive, but UNH is near resistance after a sharp monthly rise, while the latest session fell and volume was below average. The golden cross, positive MACD and rising OBV support the trend; neutral oscillators and widening bands argue for caution.
- Ideal Entry Range: US$388.75–US$390.86, around the SMA50 and SMA20.
- Exit Target: US$424.98–US$430.11, at 20-day resistance and the upper Bollinger band.
- Stop Loss: US$365.20, at 20-day support.
- Invalidation: The HOLD verdict is invalidated if price falls below US$365.20.
In plain English, the trend is improving, but the price is close enough to resistance that confirmation matters more than momentum alone.
Data: Exchange data, as of October 27, 2026, 03:00 WIB.
Why UNH is in focus today
Fresh golden cross: SMA20 crossed above SMA50
Selected automatically from 30 NYSE (US) stocks by a technical-signal score with daily weighted randomisation — not a recommendation.
Summary Data UNH
Last price
410.70 USD
Change 1 day / 5 days / 1 month
-1.77% / 0.94% / 8.70%
Trend / MA-cross
uptrend / golden
SMA20 / SMA50
390.86 / 388.75
RSI (14) / Stochastic %K
59.9 / 72.7
Bollinger %B / ATR
75% / 13.50
Support / Resistance 20 days
365.20 / 424.98
Data as of
27 October 2026 03:00 WIB
Advertisement
Disclaimer: This technical analysis is generated automatically from exchange data (via Yahoo Finance) and indicators calculated by JournalArta, for information and education only. The verdict and the entry, target and stop-loss levels are not investment advice or a solicitation to buy or sell any security. Investment decisions and their risks rest solely with the reader.