ThaiBev Stock Technicals: Gains 1.15% on Monday, Testing Key Resistance
On October 26, 2026: price 0.44 SGD, trend sideways, RSI 60.1, support 0.42, resistance 0.44. technical analysis of thaibev stock.
By Alistair Sterling
October 26, 20265 min read
Advertisement
ThaiBev Stock Technicals
Why ThaiBev is in focus today
Volume at 3.0× the 20-day average
Closed at a 20-day high (0.44)
Breaking out of a Bollinger squeeze (band width 4.1%)
Selected automatically from 16 SGX (Singapore) stocks by a technical-signal score with daily weighted randomisation — not a recommendation.
Thai Beverage shares on Singapore’s SGX closed at S$0.44 on Oct. 26, at their 20-trading-day high, as volume jumped to three times its 20-day average and the stock moved out of a narrowing Bollinger band. The combination makes the session notable: participation increased as price reached the top of its recent range, but the breakout signal is not yet backed by a clear trend or a fresh moving-average crossover. Market data showed the shares up 1.15% on the day and 3.53% over five trading days.
Advertisement
Trend & Price Action
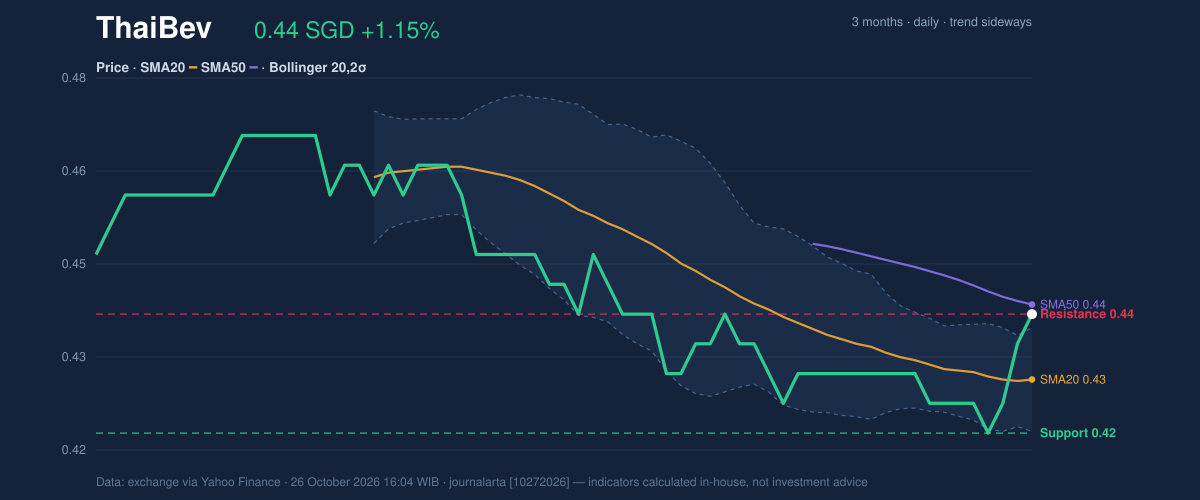
ThaiBev’s short-term structure is improving, though it remains broadly sideways. The share price is above its 20-day simple moving average (SMA), at S$0.43, but is level with the 50-day SMA at S$0.44. The 20-day average is still edging down, by 0.35% over five days, and there has been no new crossover between the averages. That means the recent rise has yet to establish a stronger, sustained trend.
The stock ended at S$0.44, the 20-day resistance and the top of its 20-day range. That position can signal buyers are testing a ceiling; it also leaves little room within the recent range before a move would need to clear resistance to demonstrate follow-through. Over the past three months, the shares have traded between S$0.41 and S$0.47.
As shown in the chart, price has pushed above the middle Bollinger band, but it is also beyond the upper band: the band reading’s %B is 113%. This suggests the move is strong relative to recent volatility, while warning that price has reached an extended position rather than confirming that a breakout will hold.
3-month price action chart of ThaiBev: price, SMA20/50, Bollinger, support & resistance. Data: exchange.
Advertisement
Oscillators & Momentum
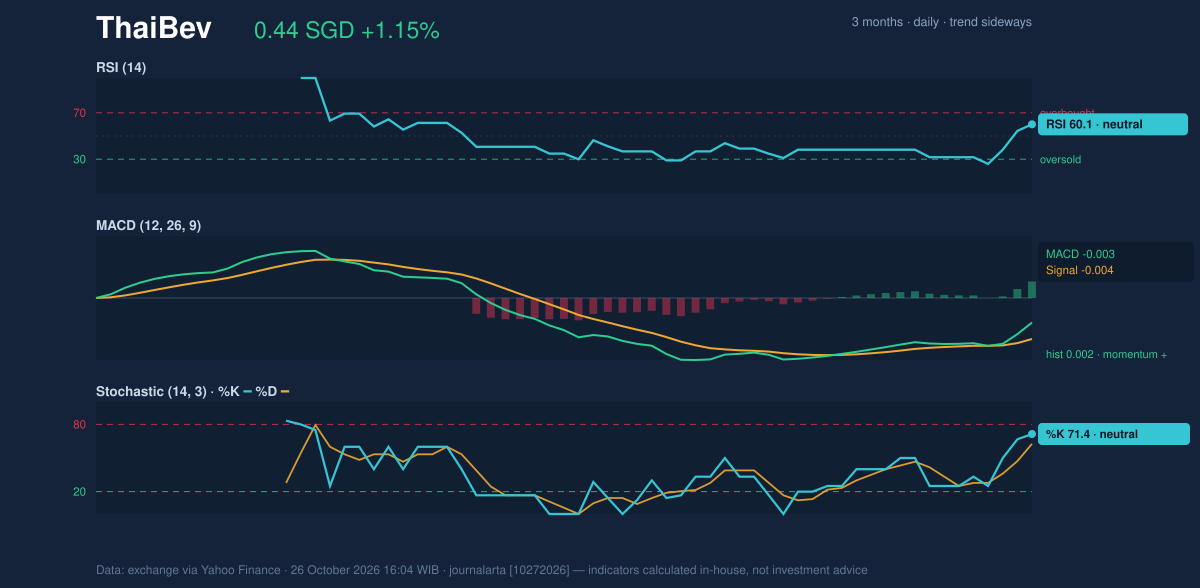
Momentum indicators lean positive without showing an extreme reading. RSI is 60.1, a neutral reading, meaning recent gains have not yet pushed the measure into traditionally overbought territory. The stochastic readings—%K at 71.4 and %D at 62.7, both neutral—also point to improving momentum, but do not independently establish a durable reversal.
MACD offers the clearest confirmation of a near-term pickup. The MACD histogram is positive at 0.002, while the MACD line remains negative at -0.003 and its signal line is -0.004. In plain terms, downward momentum has eased and the faster measure has moved above the signal line, but both lines are still below zero. The shift is constructive; it is not yet evidence of a fully developed uptrend.
Momentum chart of ThaiBev: RSI(14), MACD, Stochastic. Data: exchange.
Volatility & Volume
The Bollinger bands are narrow, with a width of 4.1%, a setup often associated with a period of compressed price movement before volatility expands. ThaiBev has begun moving beyond that compression, but a squeeze signals the potential for a larger move, not its direction. The upper band is at S$0.44 and the lower at S$0.42, placing the close at the upper edge of the recent volatility envelope.
Volume gives the move added weight. Trading reached 31,153,900 shares, or 3.0 times the 20-day average of 10,410,285, while on-balance volume (OBV), a running measure of whether volume is associated with rising or falling prices, also rose. That alignment suggests buyers participated in the advance. The average true range (ATR) is S$0.01, equivalent to 2.3% of the share price, indicating moderate day-to-day volatility rather than an unusually wide trading range.
Advertisement
Key Levels & Scenarios
The immediate test is whether ThaiBev can sustain a close above S$0.44, its 20-day resistance. A hold above that level would strengthen the case that the volume-backed move is more than a brief test of the range ceiling; failure to stay above it would leave the sideways structure intact. The 20-day support is S$0.42, near the lower Bollinger band. A break below that area would weaken the positive momentum reading and put the three-month low of S$0.41 in focus.
Technical Verdict: HOLD (wait & see)
The indicators support a cautious, neutral verdict rather than a confirmed directional call. First, the price is testing resistance at S$0.44 but has not established a move beyond it. Second, rising volume and OBV, together with the positive MACD histogram, show improving participation and momentum. Third, the sideways trend and declining slope of the 20-day average argue against treating the session as a confirmed trend reversal.
- Ideal entry range: S$0.42–S$0.43, around 20-day support and the 20-day SMA.
- Exit target: S$0.44, the current 20-day resistance level.
- Stop-loss protection: S$0.42, using the 20-day support and lower Bollinger band as the boundary.
- Invalidation: The cautious verdict is invalidated if price falls below S$0.42.
For non-traders, the signal is that momentum has improved, but the shares still need to show whether they can hold above their recent ceiling.
Advertisement
Data Table
Indicator
Reading
Last price
S$0.44
Daily change
+1.15%
Five-day change
+3.53%
SMA20 / SMA50
S$0.43 / S$0.44
RSI (14)
60.1
Stochastic %K / %D
71.4 / 62.7
MACD / signal / histogram
-0.003 / -0.004 / 0.002
Bollinger bands (upper / middle / lower)
S$0.44 / S$0.43 / S$0.42
Volume / 20-day average
31,153,900 / 10,410,285
20-day support / resistance
S$0.42 / S$0.44
Summary Data ThaiBev
Last price
0.44 SGD
Change 1 day / 5 days / 1 month
1.15% / 3.53% / 1.15%
Trend / MA-cross
sideways / none
SMA20 / SMA50
0.43 / 0.44
RSI (14) / Stochastic %K
60.1 / 71.4
Bollinger %B / ATR
113% / 0.01
Support / Resistance 20 days
0.42 / 0.44
Data as of
26 October 2026 16:04 WIB
Disclaimer: This technical analysis is generated automatically from exchange data (via Yahoo Finance) and indicators calculated by JournalArta, for information and education only. The verdict and the entry, target and stop-loss levels are not investment advice or a solicitation to buy or sell any security. Investment decisions and their risks rest solely with the reader.