TMUS Testing Support Level: Stock Drops 7.71% (October 23, 2026)
On October 23, 2026: price 146.54 USD, trend downtrend, RSI 35.4, support 146.54, resistance 171.31. technical analysis of tmus stock.
By Elena Vance
October 26, 20264 min read
Advertisement
TMUS Testing Support Level
Why TMUS is in focus today
One-day move of -7.71%, about 1.7× its average daily range (ATR)
Trading near its 3-month low (146.32)
MACD histogram has just turned negative
Downtrend extending (5-day change -7.89%)
Selected automatically from 32 NASDAQ (US) stocks by a technical-signal score with daily weighted randomisation — not a recommendation.
TMUS’s 7.71% one-day drop puts the US wireless carrier’s shares at the bottom of their three-month range, a sharp move that matters beyond one session: it combines continued selling pressure with a fresh shift in momentum.
According to market data from the exchange, T-Mobile US ended at $146.54 on Oct. 24, down from $158.79 at the previous close. The decline was about 1.7 times the stock’s average daily trading range, measured by ATR, while the shares fell 7.89% over five days and 11.42% over one month. The move brings the price close to its three-month low of $146.32.
Advertisement
Trend & Price Action
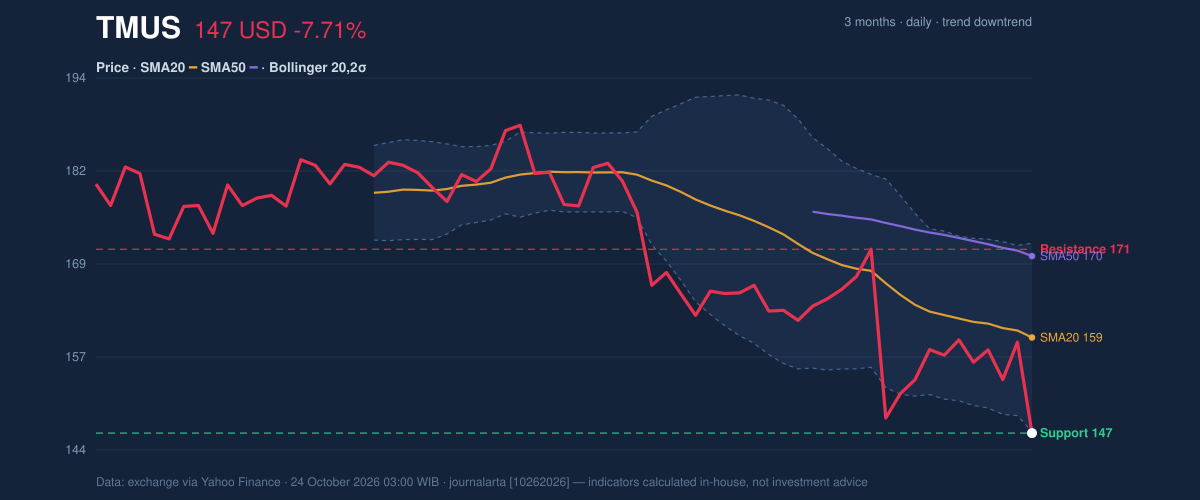
The share price is below both its 20-day simple moving average, or SMA, at $159.42 and its 50-day SMA at $170.40. These averages track recent prices and help show the direction of the trend; their position above the current price signals that the decline is not confined to the latest session. The 20-day average is also falling, down 1.58% over five days. No new moving-average crossover has formed, so there is no fresh cross signal to offset the broader weakness.
At $146.54, TMUS sits at the lower edge of its 20-day Bollinger Band, whose lower boundary is $146.73. Bollinger Bands widen or narrow with price volatility; a move just below the lower band can reflect strong selling, but does not by itself establish a reversal. The price is at 0% of its stated 20-day range, with $146.54 support and $171.31 resistance.
3-month price action chart of TMUS: price, SMA20/50, Bollinger, support & resistance. Data: exchange.
The nearest reference point is the three-month low at $146.32, just below the stated support. If the price holds around that zone, it could mark a pause after the sell-off; a break beneath it would put the existing range support under pressure. A recovery would first need to reclaim the $159.42 20-day average before the higher $170.40 50-day average becomes relevant.
Advertisement
Oscillators & Momentum
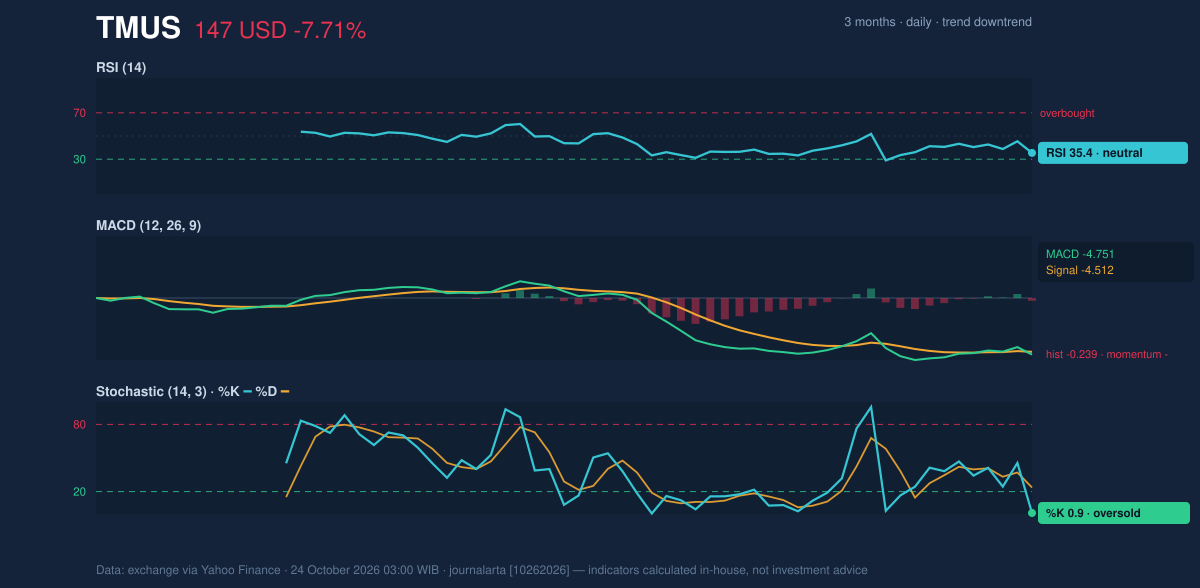
The momentum indicators are weak, though they do not all imply the same thing. The MACD histogram has turned negative at -0.239, with MACD at -4.751 below its -4.512 signal line. MACD compares shorter- and longer-term price momentum; a negative histogram indicates that recent downside momentum has strengthened relative to the signal line.
The Stochastic is oversold, with %K at 0.9 and %D at 23.6. This indicator compares the latest close with a recent trading range. A very low reading can appear after a steep fall, but it is not proof that selling has ended. The RSI is 35.4, classified as neutral in the supplied data, leaving it short of an oversold reading even as price approaches its three-month low.
Momentum chart of TMUS: RSI(14), MACD, Stochastic. Data: exchange.
The contrast is important: the Stochastic shows an extreme short-term reading, while MACD confirms negative momentum and RSI remains neutral. That mix leaves room for a technical rebound, but offers no broad confirmation that a durable turn has begun.
Advertisement
Volatility & Volume
The ATR is $6.61, or 4.5% of the share price, indicating high day-to-day volatility. The latest session’s 7.71% decline was therefore larger than the stock’s typical daily range. Bollinger Band width is 15.9%, described as normal rather than unusually compressed or expanded; the data point to a forceful move, not a clear volatility squeeze.
Trading volume reached 8,560,100 shares, about 1.4 times the 20-day average of 6,063,005. That heavier activity suggests broad participation in the decline rather than a move on unusually thin trading. OBV, a running measure that compares volume on rising and falling sessions, is nevertheless rising. This is a counter-signal, but without more detail on its recent path it does not outweigh the falling price, negative MACD histogram and above-price moving averages.
Technical Verdict: HOLD (wait & see)
The technical picture supports a HOLD (wait & see) verdict: the trend and MACD remain bearish, while oversold Stochastic conditions and rising OBV argue against treating the latest drop as a confirmed continuation. The key reasons are the price below the SMA20 and SMA50, the newly negative MACD histogram, and the Stochastic’s oversold reading alongside rising OBV. This verdict is invalidated if price breaks below $146.32, the three-month low.
Ideal entry range: $146.32–$146.73, the three-month low and lower Bollinger boundary.
Exit target: $159.42, the SMA20 resistance reference.
Stop-loss protection: Below $146.32, which would signal a break of the three-month low.
Advertisement
In plain English, the chart is still weak, but the selling is sufficiently stretched that confirmation around support matters before the next direction is clear.
Summary Data TMUS
Last price
146.54 USD
Change 1 day / 5 days / 1 month
-7.71% / -7.89% / -11.42%
Trend / MA-cross
downtrend / none
SMA20 / SMA50
159.42 / 170.40
RSI (14) / Stochastic %K
35.4 / 0.9
Bollinger %B / ATR
-1% / 6.61
Support / Resistance 20 days
146.54 / 171.31
Data as of
24 October 2026 03:00 WIB
Disclaimer: This technical analysis is generated automatically from exchange data (via Yahoo Finance) and indicators calculated by JournalArta, for information and education only. The verdict and the entry, target and stop-loss levels are not investment advice or a solicitation to buy or sell any security. Investment decisions and their risks rest solely with the reader.