SGX Stock Technicals: Drops 0.34% on Friday, Testing Support Level
Singapore Exchange shares closed down 0.34% at SGD 20.77 on October 23, extending a downtrend near the bottom of their three-month range. RSI stands at 34.8, with 20-session support at 20.64 and resistance at 22.61.
Trend & Price Action
SGX is trading below its SMA20, the 20-session average price, at SGD 21.25, and its SMA50 at SGD 23.04. Both benchmarks place the price in a weak structure, while the SMA20’s 2.02% downward slope over five days signals that short-term weakness is still developing. There has been no new crossover between the moving averages; the data therefore does not show a confirmed change in trend. The three-month range runs between SGD 20.41 and SGD 25.69. The latest price is only slightly above that low and sits in the bottom 7% of the 20-session support-resistance range, from SGD 20.64 to SGD 22.61. Proximity to the bottom could trigger attempts at stabilization, but it is not proof that a reversal has occurred. As long as the price stays below the SMA20, trend pressure remains downward.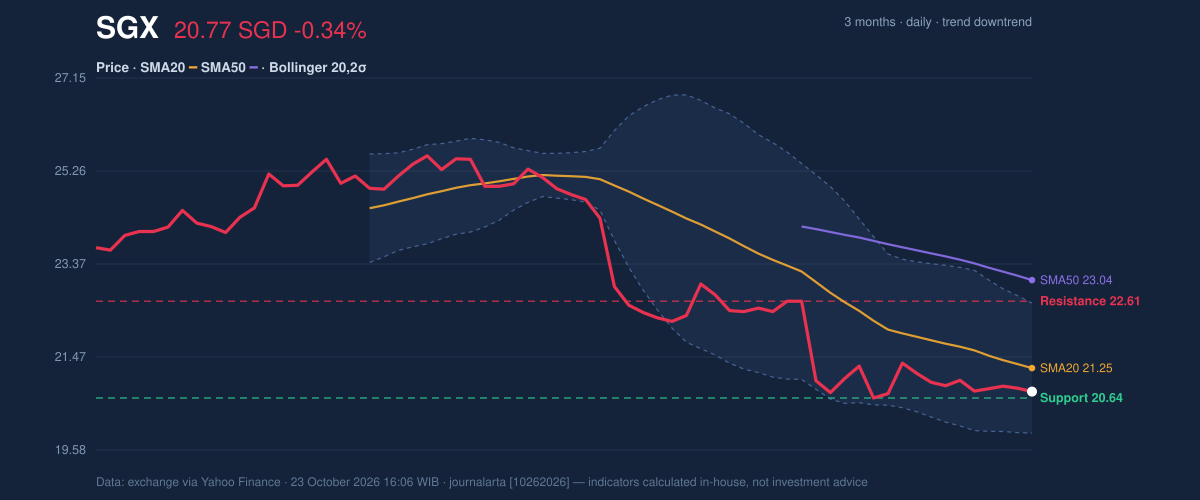
Oscillators & Momentum
The 14-day RSI is at 34.8 and the Stochastic shows %K at 29.0 and %D at 28.7; all three are classified as neutral in the data. The figures reflect weak momentum, but do not strongly confirm that the price is already oversold. For that reason, proximity to the three-month low needs to be read together with trend and volume, not as a reversal signal on its own. MACD is still negative at -0.597, but sits above its signal line at -0.672, producing a positive histogram of 0.075. This suggests downward momentum may be losing strength or that there is a short-term recovery push. However, a negative MACD and a price still below the SMA20 show the improvement is not yet enough to change the trend structure. A positive MACD histogram signals recovering momentum, not confirmation that the trend has reversed.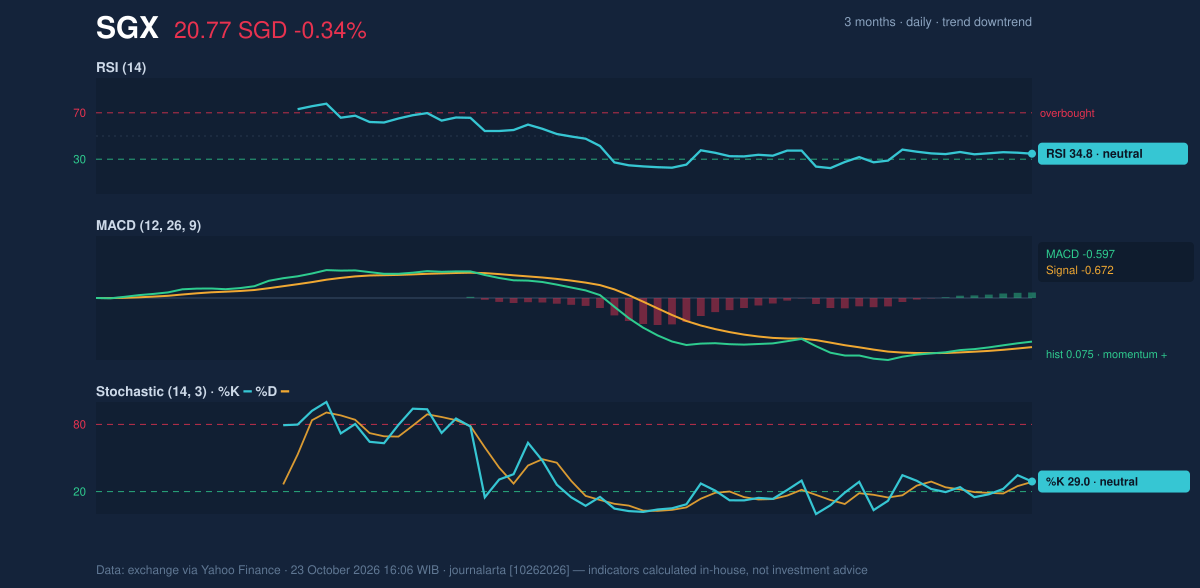
Volatility, Volume & Levels
The 14-day ATR of SGD 0.48, or 2.3% of the price, indicates moderate volatility: daily moves remain meaningful, but the data shows no unusual spike in volatility. The latest volume was 2,699,450 shares, about 0.7 times the 20-session average of 3,737,178. OBV, a cumulative measure comparing volume on up days and down days, is also declining. The combination of below-average volume and weakening OBV suggests buyer participation is not yet convincing. 20-session support is at SGD 20.64, while the three-month low is SGD 20.41. If the price breaks and holds below that area, the technical structure risks weakening further; the available data does not give a next level to set a downside target. Conversely, holding above support and then reclaiming the SMA20 at SGD 21.25 would be an early sign of stabilization. 20-session resistance at SGD 22.61 is the key upper limit for testing whether a recovery has enough strength.Technical Verdict: HOLD (wait & see)
Technical verdict: HOLD (wait & see). The price is below the SMA20 and SMA50, with a negative SMA20 slope; OBV is falling and the latest volume is only 0.7 times the average, so the trend has not yet received strong buying support. On the other hand, the positive MACD histogram and a price still above support at SGD 20.64 mean the signals are not entirely one-directional. This verdict no longer applies if the price breaks below SGD 20.64, the 20-session support. - Ideal entry range: SGD 20.64–21.25, the area between 20-session support and the SMA20, to observe whether the price holds and begins to reclaim that average. - Exit target: SGD 22.61, the 20-session resistance that marks the limit for testing the recovery. - Stop-loss protection: below SGD 20.41, the three-month low. For non-trader readers, HOLD means the data does not yet show enough evidence to determine whether selling pressure will continue or the price can recover.Why SGX is in focus today
- Trading near its 3-month low (20.41)
- Downtrend extending (5-day change -1.10%)
- Not covered by JournalArta in the last 14 days
Selected automatically from 16 SGX (Singapore) stocks by a technical-signal score with daily weighted randomisation — not a recommendation.
Summary Data SGX
| Last price | 20.77 SGD |
| Change 1 day / 5 days / 1 month | -0.34% / -1.10% / -7.28% |
| Trend / MA-cross | downtrend / none |
| SMA20 / SMA50 | 21.25 / 23.04 |
| RSI (14) / Stochastic %K | 34.8 / 29.0 |
| Bollinger %B / ATR | 32% / 0.48 |
| Support / Resistance 20 days | 20.64 / 22.61 |
| Data as of | 23 October 2026 16:06 WIB |
Disclaimer: This technical analysis is generated automatically from exchange data (via Yahoo Finance) and indicators calculated by JournalArta, for information and education only. The verdict and the entry, target and stop-loss levels are not investment advice or a solicitation to buy or sell any security. Investment decisions and their risks rest solely with the reader.