NVDA Stock Technicals: Drops 0.59% on Friday, Testing Support Level
On October 23, 2026: price 210.96 USD, trend sideways, RSI 38.2, support 210.96, resistance 239.24. technical analysis of nvda stock.
By Elena Vance
October 26, 20264 min read
Advertisement
NVDA Stock Technicals
Why NVDA is in focus today
Closed at a 20-day low (210.96)
Selected automatically from 32 NASDAQ (US) stocks by a technical-signal score with daily weighted randomisation — not a recommendation.
Nvidia closed at $210.96 on the Nasdaq on Oct. 23, ending at its lowest level in 20 trading days as shares slipped 0.59%. The close puts the stock at the lower edge of its recent range, while price-based momentum indicators remain weak. The signal is worth watching. Data are from exchange trading records as of Oct. 24, 2026, 03:00 WIB.
Trend & Price Action
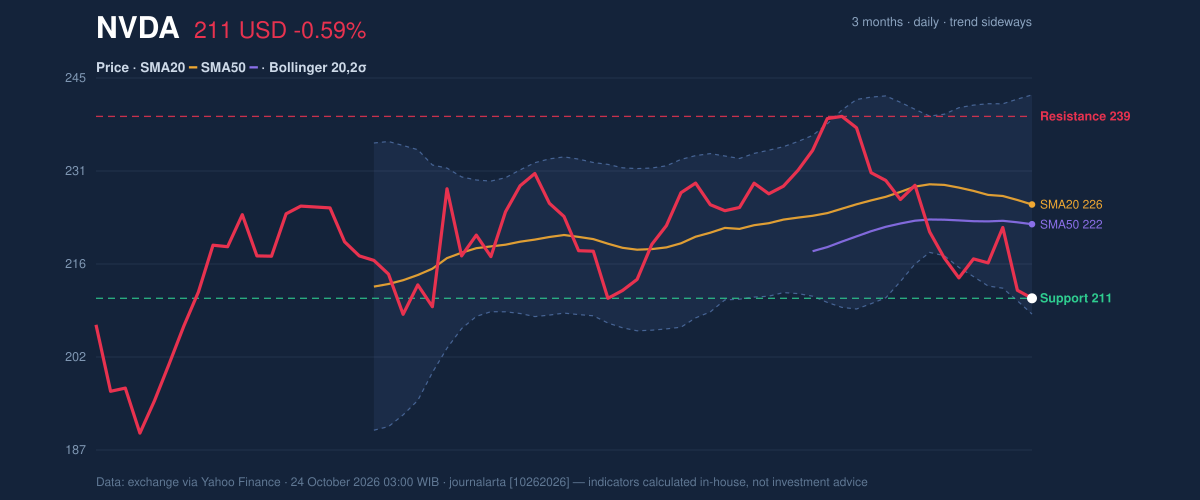
Nvidia’s shares are down 1.48% over five days and 6.27% over one month, a decline that has left the stock below both its 20-day and 50-day moving averages. The 20-day average, at $225.54, is falling, with its slope down 1.16% over five days; the 50-day average stands at $222.48. That configuration points to near-term weakness, though no new moving-average crossover has formed. In other words, the decline has not yet produced a fresh technical signal that confirms a longer-term shift.
The stock is sitting at the bottom of its 20-day range, with $210.96 support marking the current low and $239.24 resistance at the upper end. It is also close to the lower Bollinger Band at $208.51. Bollinger Bands track how far prices move around a rolling average; a touch near the lower band can signal selling pressure, but does not by itself establish that a rebound has begun. The bands’ 15.1% width is described as normal, rather than unusually tight or expanded.
The broader three-month range is $190.01 to $243.37, placing the current price above its period low but well below its high. That context suggests the latest weakness is significant within the recent trading pattern, without establishing that the stock has reached a durable floor.
3-month price action chart of NVDA: price, SMA20/50, Bollinger, support & resistance. Data: exchange.
Advertisement
Oscillators & Momentum
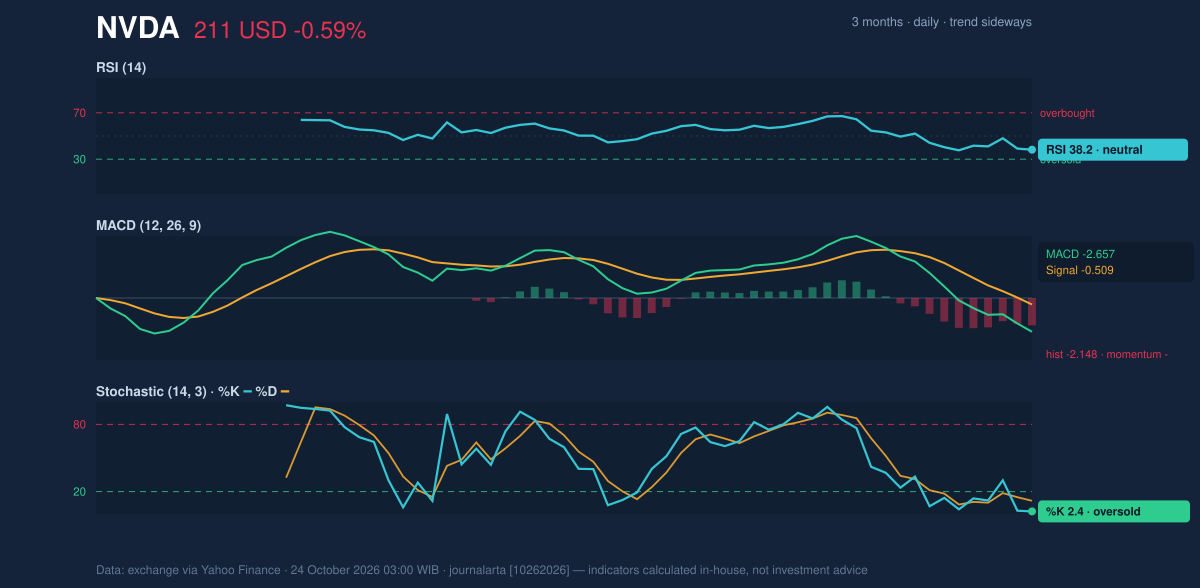
The momentum readings are mixed at the margin but predominantly negative. The Relative Strength Index, or RSI, is 38.2 and classified as neutral; it is below the midpoint commonly used to distinguish stronger from weaker momentum, but not at an extreme reading. The Stochastic oscillator, which compares a recent close with its trading range, is deeply oversold: %K is 2.4 and %D is 11.8. Such readings can occur after a sustained decline and may leave room for a short-term bounce, but they are not confirmation of one.
The Moving Average Convergence Divergence indicator, or MACD, is more clearly bearish: MACD is -2.657, below its -0.509 signal line, with a -2.148 histogram. The histogram measures the gap between the MACD line and its signal line; its negative reading indicates downside momentum remains in control. A turn higher in these readings would be needed to suggest that selling pressure is easing.
Momentum chart of NVDA: RSI(14), MACD, Stochastic. Data: exchange.
Advertisement
Volatility & Volume
Average True Range, a measure of typical daily price movement, is $5.98, or 2.8% of the share price. That points to moderate volatility: moves can be meaningful, but the data do not indicate an unusually turbulent session pattern.
Trading volume was 79,987,200 shares, about 0.8 times the 20-day average of 105,294,570. On-Balance Volume, which combines price direction and volume to track buying and selling participation, is falling. Together, lighter-than-average turnover and declining OBV show that participation is not yet supporting a recovery. The data do not show a strong accumulation signal at the current low.
Technical Verdict: HOLD (wait & see)
The technical picture supports HOLD (wait & see): price is below both moving averages, MACD momentum is negative, and falling OBV offers no volume-based confirmation of a turn. The oversold Stochastic reading is a counterpoint, but it is not enough on its own to reverse those signals. This verdict is invalidated if price falls below $208.51, the lower Bollinger Band.
Ideal entry range: $208.51–$210.96, around the lower Bollinger Band and current 20-day support.
Exit target: $225.54–$239.24, spanning the 20-day average to 20-day resistance.
Stop-loss protection: Below $208.51, the lower Bollinger Band.
Advertisement
For non-traders, the indicators show that Nvidia remains under pressure, even though its Stochastic reading signals that the decline has become stretched.
Metric
Latest reading
Last price
$210.96
Daily change
-0.59%
SMA20 / SMA50
$225.54 / $222.48
Bollinger lower / middle / upper
$208.51 / $225.54 / $242.58
RSI(14)
38.2
Stochastic %K / %D
2.4 / 11.8
MACD / signal / histogram
-2.657 / -0.509 / -2.148
ATR(14)
$5.98
Volume / 20-day average
79,987,200 / 105,294,570
20-day support / resistance
$210.96 / $239.24
Summary Data NVDA
Last price
210.96 USD
Change 1 day / 5 days / 1 month
-0.59% / -1.48% / -6.27%
Trend / MA-cross
sideways / none
SMA20 / SMA50
225.54 / 222.48
RSI (14) / Stochastic %K
38.2 / 2.4
Bollinger %B / ATR
7% / 5.98
Support / Resistance 20 days
210.96 / 239.24
Data as of
24 October 2026 03:00 WIB
Disclaimer: This technical analysis is generated automatically from exchange data (via Yahoo Finance) and indicators calculated by JournalArta, for information and education only. The verdict and the entry, target and stop-loss levels are not investment advice or a solicitation to buy or sell any security. Investment decisions and their risks rest solely with the reader.