PG Stock Technicals: Gains 5.58% on Thursday, RSI Overbought
On October 22, 2026: price 165.59 USD, trend uptrend, RSI 74.5, support 143.95, resistance 165.59. technical analysis of pg stock.
By Elena Vance
October 23, 20264 min read
Advertisement
PG Stock Technicals
Why PG is in focus today
One-day move of 5.58%, about 2.9× its average daily range (ATR)
Volume at 2.2× the 20-day average
Closed at a 20-day high (165.59)
Trading near its 3-month high (166.85)
RSI(14) at 74.5 — overbought zone
Uptrend confirmed (5-day change 5.42%)
Selected automatically from 30 NYSE (US) stocks by a technical-signal score with daily weighted randomisation — not a recommendation.
Procter & Gamble rose 5.58% to $165.59, a move about 2.9 times its average daily trading range, as volume reached 2.2 times its 20-day average. The consumer-goods company’s shares closed at their highest level in 20 trading days and near their three-month high of $166.85. The surge combines strong demand with signs the rally may be stretched: the price has moved above the upper Bollinger Band, while momentum gauges are in overbought territory.
The data, sourced from exchange information as of October 23, 2026, show the stock up 5.42% over five days and 13.67% over one month. That makes PG worth watching not simply for its gain, but for the tension between forceful buying and the possibility that prices have run ahead of their recent trading range.
Advertisement
Trend & Price Action
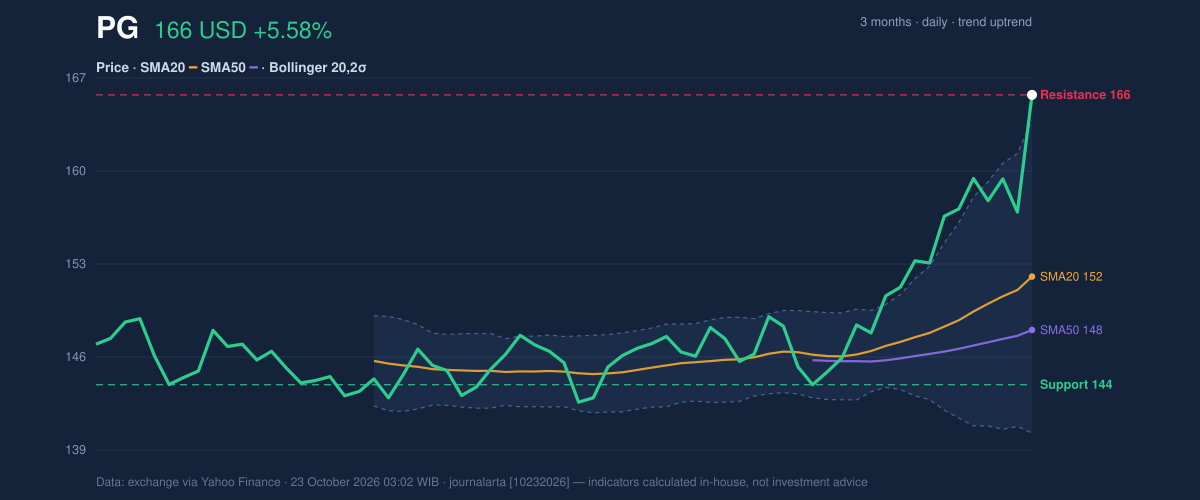
PG’s rising trend has support from its moving averages: the last price of $165.59 is above the 20-day average of $152.02 and the 50-day average of $148.03. The 20-day average has climbed 2.19% over five days, reinforcing the upward direction. There has been no new moving-average crossover, so the evidence points to an established uptrend rather than a fresh technical turning point.
The move is also unusually extended. The upper Bollinger Band, a measure of the recent price range, stands at $163.70; PG closed above it, with the band reading at 108% of its range. This can signal forceful buying, but it is not proof that gains will continue: prices outside the band can also be vulnerable to a pause or retreat. The band’s width is normal, not unusually narrow, so the data do not indicate a volatility squeeze preceding a breakout.
Closing above the upper band signals strength, but also leaves little room for the rally to cool without slipping back inside its recent range.3-month price action chart of PG: price, SMA20/50, Bollinger, support & resistance. Data: exchange.
Advertisement
Oscillators & Momentum
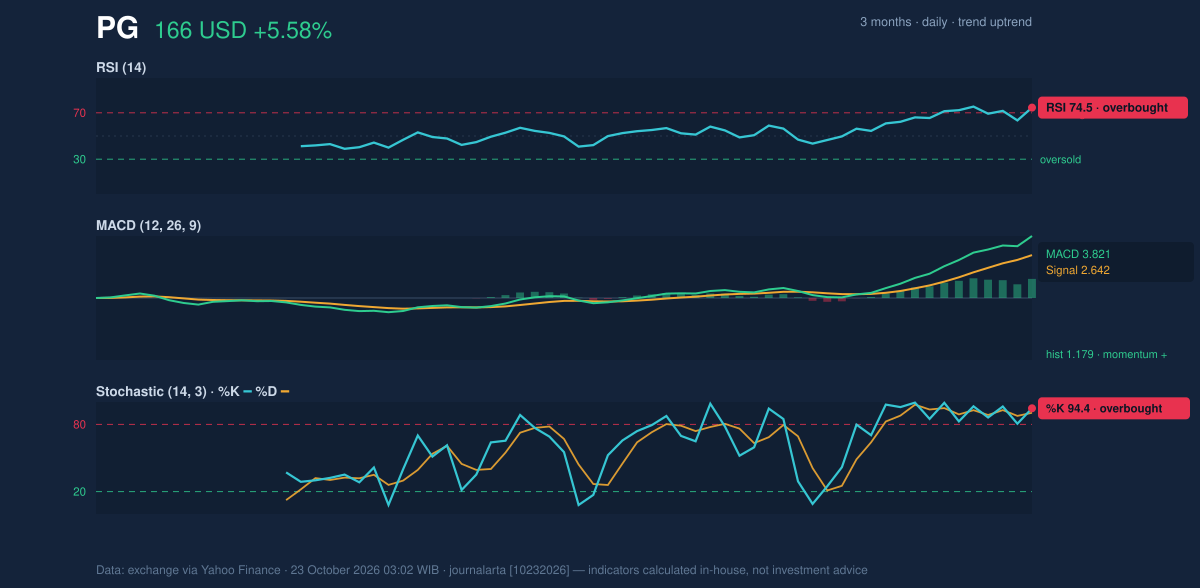
Momentum confirms the trend, while warning that it is crowded. The RSI is 74.5, in overbought territory; the Stochastic readings of 94.4 and 90.3 are also overbought. These measures compare recent gains with losses or the stock’s position within its recent range. High readings describe a powerful advance, not an automatic reversal, but they raise the risk that new buyers are entering after much of the near-term move has already occurred.
The MACD is positive at 3.821, above its 2.642 signal line, with a positive histogram of 1.179. That supports the bullish trend reading: upward momentum remains stronger than the signal used to track it. Whether that momentum can persist is less certain given the overbought oscillators and the sharp one-day rise.
Momentum chart of PG: RSI(14), MACD, Stochastic. Data: exchange.
Volatility, Volume & Key Levels
Volume provides meaningful confirmation: 22,021,000 shares traded, versus a 20-day average of 9,828,365, while on-balance volume is rising. OBV adds up volume on rising-price days and subtracts it on falling days; its increase suggests participation has broadly backed the advance rather than the price rise occurring on thin trading. Still, a volume spike on an unusually large daily move can reflect a burst of activity, not a guarantee of follow-through.
ATR, which estimates average price movement, is $3.15, or 1.9% of the share price, indicating moderate volatility. The 20-day resistance is $165.59, the current price, while the three-month high is $166.85. A sustained move above that high would put the shares beyond the recent peak; failure to hold the breakout could bring the $163.70 upper band into focus, with the $152.02 20-day average a deeper trend reference. The stated 20-day support is $143.95.
3-month price action chart of PG: price, SMA20/50, Bollinger, support & resistance. Data: exchange.
Advertisement
Technical Verdict: HOLD (wait & see)
The technical reading is a tug-of-war: the trend, positive MACD, rising OBV and volume surge favor strength, but RSI and Stochastic are overbought and the close is above the upper Bollinger Band. That mix supports a HOLD (wait & see) verdict rather than treating the latest burst as confirmation of an uninterrupted advance. The verdict is invalidated if PG falls below $143.95, the stated 20-day support.
- Ideal entry range: $152.02–$163.70, bounded by the 20-day average and upper Bollinger Band.
- Exit target: $166.85, the three-month high.
- Stop-loss protection: $143.95, the 20-day support.
For non-traders, the chart still points upward, but the price has climbed far enough that a pause would not be surprising.
Indicator
Reading
Last price
$165.59
20-day / 50-day average
$152.02 / $148.03
RSI / Stochastic
74.5 / 94.4 and 90.3
MACD / signal
3.821 / 2.642
20-day support / resistance
$143.95 / $165.59
Three-month high / low
$166.85 / $140.20
Summary Data PG
Last price
165.59 USD
Change 1 day / 5 days / 1 month
5.58% / 5.42% / 13.67%
Trend / MA-cross
uptrend / none
SMA20 / SMA50
152.02 / 148.03
RSI (14) / Stochastic %K
74.5 / 94.4
Bollinger %B / ATR
108% / 3.15
Support / Resistance 20 days
143.95 / 165.59
Data as of
23 October 2026 03:02 WIB
Advertisement
Disclaimer: This technical analysis is generated automatically from exchange data (via Yahoo Finance) and indicators calculated by JournalArta, for information and education only. The verdict and the entry, target and stop-loss levels are not investment advice or a solicitation to buy or sell any security. Investment decisions and their risks rest solely with the reader.