Alibaba Testing Support Level: Stock Drops 6.12% (October 22, 2026)
On October 22, 2026: price 97.35 HKD, trend downtrend, RSI 34.7, support 97.35, resistance 110.50. technical analysis of alibaba stock.
By matthew jonathan
October 22, 20264 min read
Advertisement
Alibaba Testing Support Level
Alibaba Group fell 6.12% on the Hong Kong Stock Exchange on October 22 to HK$97.35, after trading volume surged to 2.3 times its 20-day average. The drop was about 1.4 times the stock’s average daily trading range, while the price sat near its three-month low of HK$96.80. Together, the move and heavy turnover signal forceful selling rather than a quiet drift lower; the newly negative MACD histogram adds evidence that downward momentum has strengthened.
Trend & Price Action
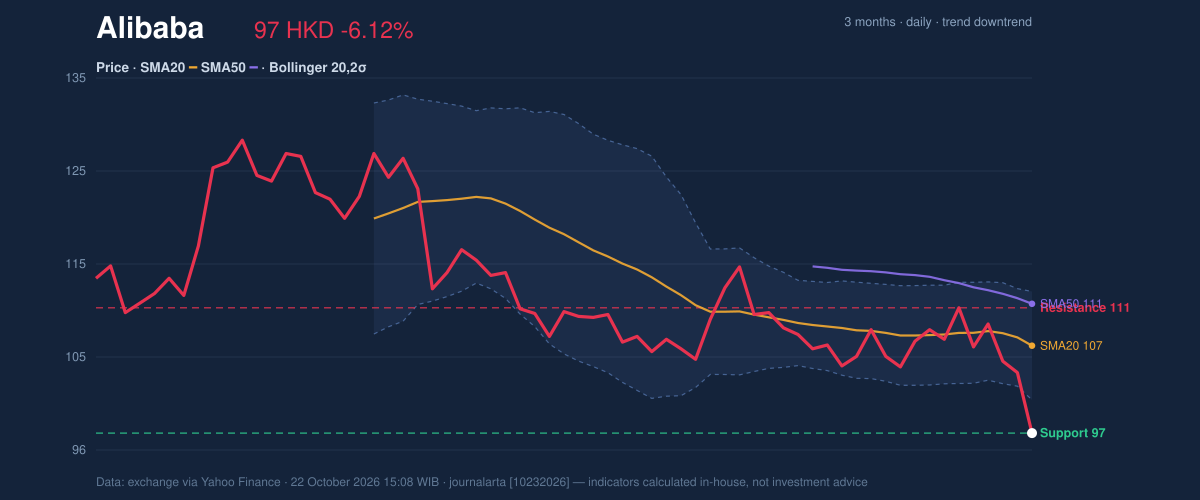
Alibaba’s share price is below both its 20-day simple moving average (SMA) of HK$106.52 and its 50-day average of HK$110.93. A moving average smooths recent prices to show direction; trading below both, alongside a falling SMA20 slope, points to a persistent downtrend. There has been no fresh crossover between the averages, so the data do not show a new trend signal from that measure.
The stock lost 11.90% over five days and 15.20% over one month. It is at the bottom of its stated 20-trading-day range, where HK$97.35 is support and HK$110.50 is resistance. The three-month low of HK$96.80 is close enough to make the area around it a test of whether buyers will defend the recent floor.
The price is under pressure, but it is also approaching a significant recent low.3-month price action chart of Alibaba: price, SMA20/50, Bollinger, support & resistance. Data: exchange.
Advertisement
The Bollinger Bands, which track price relative to a moving average and its recent volatility, place Alibaba below the lower band at HK$100.83. Its %B reading of -31% confirms that the price has moved beneath that band. This can reflect unusually weak trading, but it does not by itself prove a rebound is imminent. The band width is 10.7%, described as normal, so the data do not indicate an unusually tight volatility squeeze before the fall.
Oscillators & Momentum
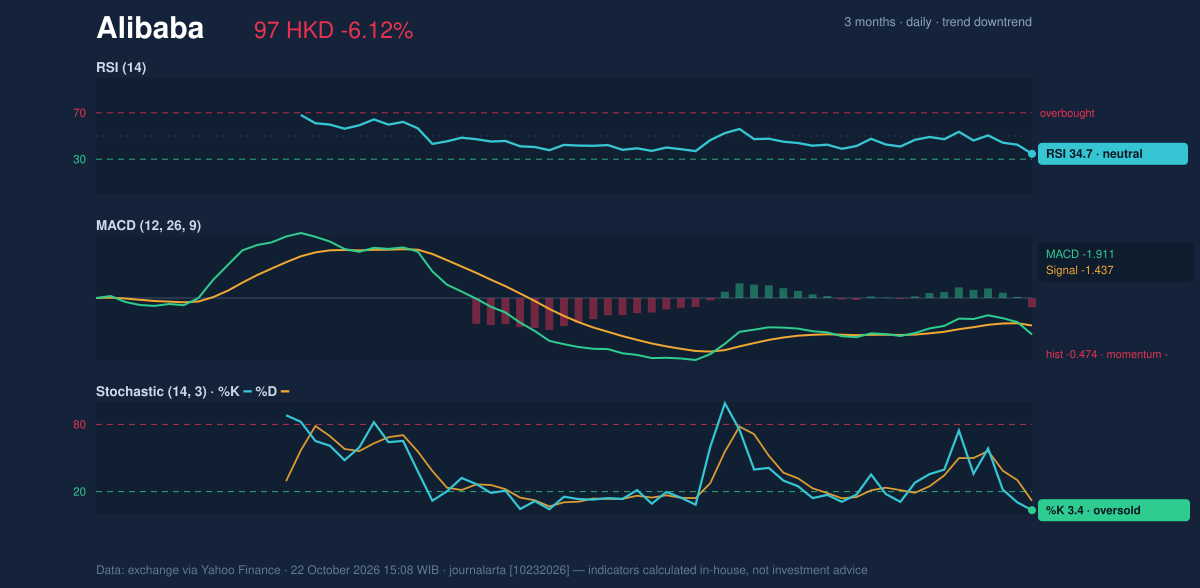
The momentum indicators paint a mixed picture. The RSI, a gauge of the speed of recent gains and losses, is 34.7 and labelled neutral in the data. Stochastic readings of 3.4 for %K and 11.8 for %D are oversold, meaning the recent decline has been steep relative to the indicator’s measurement range. Oversold conditions can precede a pause or bounce, but are not a signal that selling has ended.
MACD is negative at -1.911, below its -1.437 signal line, and its histogram is -0.474. The histogram measures the gap between those lines; its negative reading indicates that downside momentum has turned more pronounced. That matters because the oversold Stochastic reading is not yet matched by a positive turn in MACD.
Momentum chart of Alibaba: RSI(14), MACD, Stochastic. Data: exchange.
Advertisement
Volatility, Volume & Key Levels
Trading volume reached 131,777,384 shares, compared with a 20-day average of 58,382,719. That surge gives the fall greater weight: substantially more shares changed hands than usual as the price dropped. On-balance volume (OBV), which accumulates volume according to whether prices rise or fall, also declined, offering no sign that buying participation is offsetting the weakness.
Average True Range (ATR), a measure of typical price movement, is HK$4.30, or 4.4% of the share price—high volatility by the figures provided. That increases the chance of sharp moves around nearby levels. A sustained hold above the HK$96.80 three-month low could help establish a short-term floor; a break below it would expose a fresh test of lower ground, for which this data provides no further support level. On the upside, HK$100.83 marks the lower Bollinger Band, while HK$106.52 is the 20-day average and HK$110.50 the stated range resistance.
Technical Verdict: SELL
SELL is the technical verdict: price is below both moving averages, MACD momentum is negative, and falling OBV alongside unusually high volume confirms strong selling participation. The oversold Stochastic reading raises the possibility of a short-term pause, but does not yet outweigh those signals.
- Ideal Entry Range: HK$100.83–HK$106.52, bounded by the lower Bollinger Band and SMA20.
- Exit Target: HK$110.50, the stated 20-trading-day resistance.
- Stop Loss: Below HK$96.80, the three-month low.
- Invalidation: The verdict is invalidated if price breaks above HK$110.50.
For non-traders, the chart signals that sellers currently have the upper hand, though the nearby three-month low could interrupt the decline.
Data: Hong Kong exchange data, as of October 22, 2026, 15:08 WIB.
Advertisement
Why Alibaba is in focus today
One-day move of -6.12%, about 1.4× its average daily range (ATR)
Volume at 2.3× the 20-day average
Trading near its 3-month low (96.80)
MACD histogram has just turned negative
Downtrend extending (5-day change -11.90%)
Not covered by JournalArta in the last 14 days
Selected automatically from 16 HKEX (Hong Kong) stocks by a technical-signal score with daily weighted randomisation — not a recommendation.
Summary Data Alibaba
Last price
97.35 HKD
Change 1 day / 5 days / 1 month
-6.12% / -11.90% / -15.20%
Trend / MA-cross
downtrend / none
SMA20 / SMA50
106.52 / 110.93
RSI (14) / Stochastic %K
34.7 / 3.4
Bollinger %B / ATR
-31% / 4.30
Support / Resistance 20 days
97.35 / 110.50
Data as of
22 October 2026 15:08 WIB
Disclaimer: This technical analysis is generated automatically from exchange data (via Yahoo Finance) and indicators calculated by JournalArta, for information and education only. The verdict and the entry, target and stop-loss levels are not investment advice or a solicitation to buy or sell any security. Investment decisions and their risks rest solely with the reader.