On October 21, 2026: price 8,790.00 GBp, trend sideways, RSI 59.4, support 8,090.00, resistance 8,790.00. technical analysis of lseg stock.
By Alistair Sterling
October 22, 20264 min read
Advertisement
LSEG Testing Key Resistance
LSEG closed at 8,790.00 GBp, its highest level in the past 20 trading days, on 21 October, extending its gains to 4.67% over five days. The close puts the share price at the stated 20-day resistance, making the next move a test of whether recent strength can carry through that ceiling. The data, sourced from the exchange, also show a notable qualification: reported trading volume was exceptionally thin.
Trend & Price Action
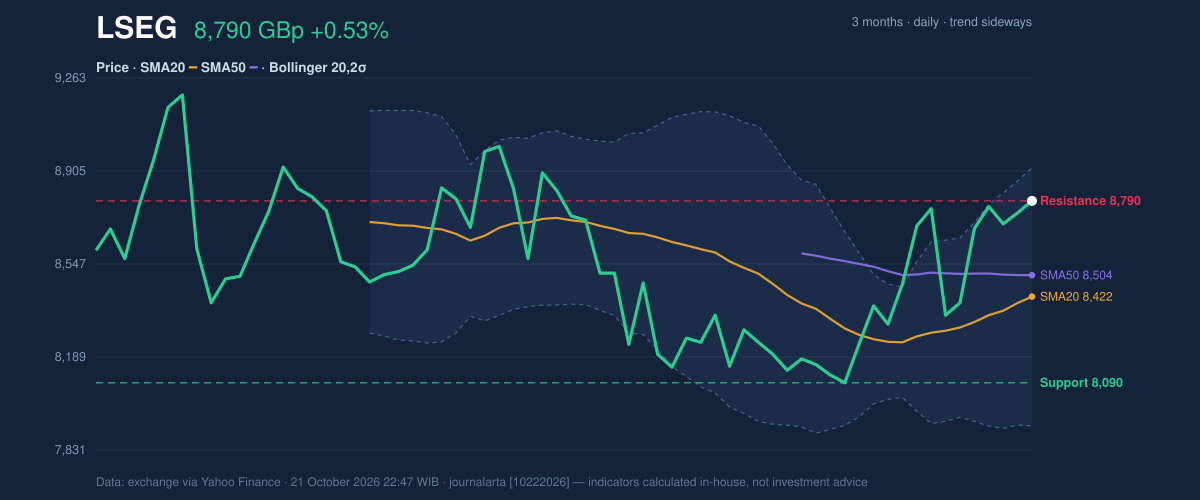
The broader price structure is sideways, but the short-term slope is improving. The share price is above its 20-day simple moving average (SMA) of 8,421.90 GBp, and that average has risen 1.43% over five days. It is also above the 50-day SMA at 8,504.12 GBp. Those levels suggest that recent trading has strengthened, although the absence of a new moving-average crossover means the data do not confirm a fresh, longer-term trend signal.
The supplied range places price at 100% of its 20-day range, with 8,090.00 GBp support and 8,790.00 GBp resistance. In plain terms, the price has reached the range’s upper boundary: a close above it would show buyers pushing beyond a level that had capped the period, while a failure to hold the move could return attention to support and the moving averages. The three-month high is 9,890.00 GBp; the reported low is 0.00 GBp, which does not provide a useful practical floor for this assessment.
As shown in the chart, price is near the upper Bollinger band at 8,919.17 GBp. Bollinger bands track how far price is moving from its recent average; the current 11.8% band width is described as normal, not a squeeze that would signal unusually compressed trading. With %B at 87%, price is in the upper part of the band, reflecting strength but also leaving less room before the upper boundary.
3-month price action chart of LSEG: price, SMA20/50, Bollinger, support & resistance. Data: exchange.
Advertisement
Oscillators & Momentum
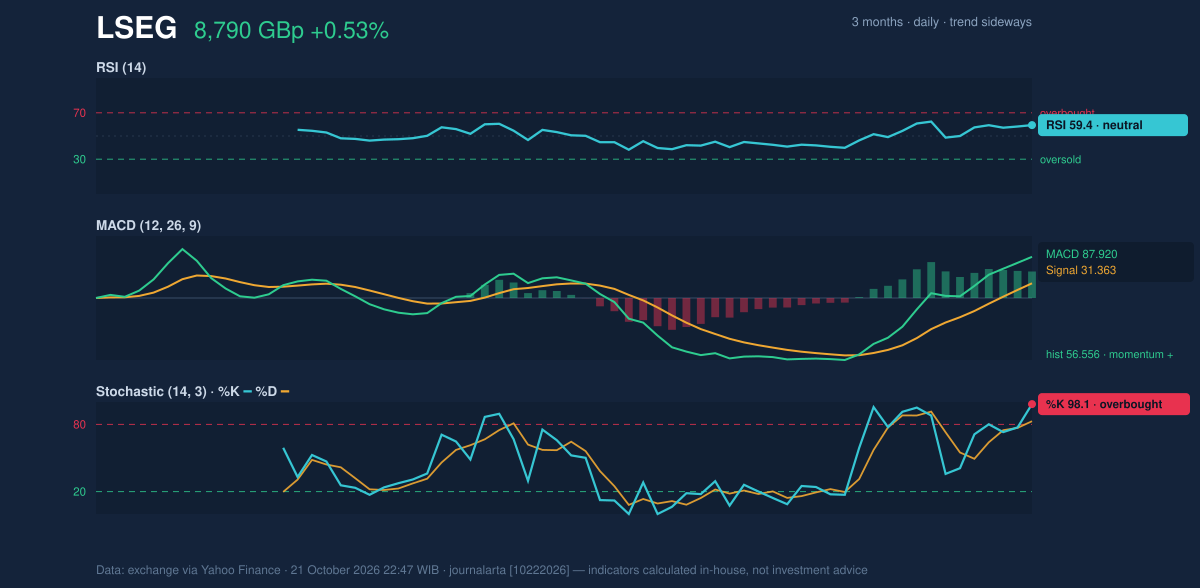
Momentum indicators are positive, but they do not all tell the same story. The RSI is 59.4, in neutral territory, consistent with improving prices without yet indicating that the share is broadly overbought by this measure. The Stochastic is overbought, with %K at 98.1 and %D at 82.9. That reading shows the latest advance has been rapid relative to recent trading; it can persist in a strong move, but it also raises the possibility of a pause or pullback.
The MACD is positive, at 87.920 against a signal line of 31.363, with a positive histogram of 56.556. MACD compares shorter- and longer-term price momentum, so the gap between the two lines supports the view that upward momentum is building. The contrast matters: MACD and the rising 20-day average confirm strength, while Stochastic warns that the move may be stretched in the near term.
Momentum chart of LSEG: RSI(14), MACD, Stochastic. Data: exchange.
Volatility, Volume & Key Levels
The average true range (ATR) is 846.16 GBp, or 9.6% of the share price, indicating high measured volatility. ATR estimates the typical size of price movement, not its direction; here, it argues for caution in interpreting a single close as a stable breakout. The last reported volume was 272 against a 20-day average of 1,273,881, classified as thin, even as on-balance volume (OBV) is rising. OBV adds or subtracts volume according to price direction, so its upward direction is supportive, but the exceptionally low reported session volume limits how strongly that can confirm the move.
The immediate reference is 8,790.00 GBp resistance, with 8,090.00 GBp support below. The 20-day SMA at 8,421.90 GBp and the 50-day SMA at 8,504.12 GBp provide intermediate levels to watch if the price retreats. A sustained move beyond resistance would strengthen the breakout case; a fall through support would invalidate the constructive technical reading used here.
Advertisement
Technical Verdict: HOLD (wait & see)
The indicators point to improving momentum, but do not yet provide a clean confirmation at the range ceiling.
- The price is above both the 20-day and 50-day SMAs, and the 20-day average is rising.
- MACD is positive, while rising OBV offers some confirmation; however, the latest volume is thin.
- Stochastic is overbought and price is at resistance, leaving a risk of a near-term pause.
The verdict is invalidated if price falls below 8,090.00 GBp support.
- Ideal entry range: 8,421.90–8,504.12 GBp, using the 20-day and 50-day SMAs as reference levels.
- Exit target (target price): 8,919.17 GBp, the upper Bollinger band.
- Stop-loss protection: 8,090.00 GBp, the stated 20-day support.
For non-traders, the signals are improving, but the price is testing a ceiling and the latest session’s thin volume leaves the breakout unconfirmed.
Data
Why LSEG is in focus today
Closed at a 20-day high (8,790.00)
Selected automatically from 16 LSE (UK) stocks by a technical-signal score with daily weighted randomisation — not a recommendation.
Advertisement
Summary Data LSEG
Last price
8,790.00 GBp
Change 1 day / 5 days / 1 month
0.53% / 4.67% / 5.98%
Trend / MA-cross
sideways / none
SMA20 / SMA50
8,421.90 / 8,504.12
RSI (14) / Stochastic %K
59.4 / 98.1
Bollinger %B / ATR
87% / 846.16
Support / Resistance 20 days
8,090.00 / 8,790.00
Data as of
21 October 2026 22:47 WIB
Disclaimer: This technical analysis is generated automatically from exchange data (via Yahoo Finance) and indicators calculated by JournalArta, for information and education only. The verdict and the entry, target and stop-loss levels are not investment advice or a solicitation to buy or sell any security. Investment decisions and their risks rest solely with the reader.