ThaiBev Stock Technicals: Drops 0.00% on Tuesday, Testing Support Level
On October 20, 2026: price 0.43 SGD, trend downtrend, RSI 31.5, support 0.43, resistance 0.44. technical analysis of thaibev stock.
By Alistair Sterling
October 20, 20264 min read
Advertisement
ThaiBev Stock Technicals
Why ThaiBev is in focus today
Closed at a 20-day low (0.43)
Trading near its 3-month low (0.42)
Downtrend extending (5-day change -1.16%)
Not covered by JournalArta in the last 14 days
Selected automatically from 16 SGX (Singapore) stocks by a technical-signal score with daily weighted randomisation — not a recommendation.
Thai Beverage closed at S$0.43 on October 20, unchanged on the day but down 1.16% over five trading days. The share ended at its 20-day low and sits close to its three-month floor of S$0.42, a combination that puts a narrow trading range under pressure. The signals point to persistent weakness, but shrinking volatility and nearly flat short-term momentum mean a decisive break has yet to appear.
Advertisement
Trend & Price Action
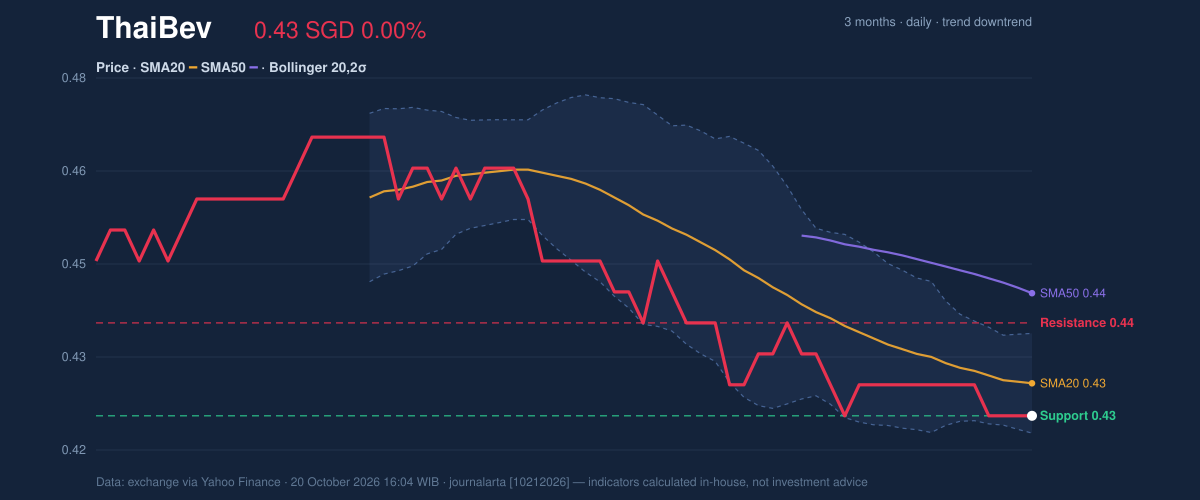
ThaiBev is trading below its 20-day average of S$0.43 and its 50-day average of S$0.44. The 20-day average is falling, while no new crossover between the averages has formed. That matters because the price has little evidence of a trend reversal: it is testing support while the broader short-term structure remains weak.
The stock’s five-day decline is modest, but its position at the bottom of the 20-day range makes the level more significant than the percentage move alone suggests. The three-month range, from S$0.42 to S$0.47, shows that the current price is also close to the period low. A sustained hold at S$0.43 would help stabilise the chart; a break toward S$0.42 would put the three-month floor in focus.3-month price action chart of ThaiBev: price, SMA20/50, Bollinger, support & resistance. Data: exchange.
Oscillators & Momentum
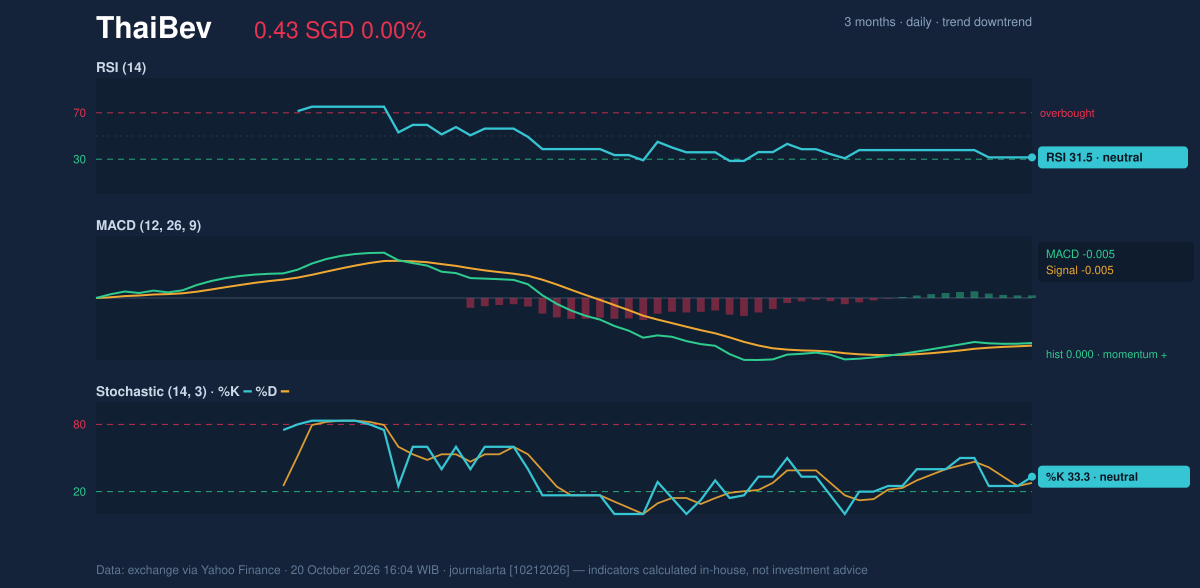
Momentum indicators are mixed rather than strongly bearish. The RSI is 31.5, a reading near the commonly watched oversold zone, although the supplied signal classifies it as neutral. RSI measures the pace of recent gains and losses; a low reading can reflect selling pressure, but it does not by itself confirm that a rebound is beginning.
The Stochastic is neutral, with %K at 33.3 and %D at 27.8. Its faster line is above the slower one, suggesting a tentative improvement in short-term momentum, but the signal is not enough to offset the falling trend and declining on-balance volume (OBV), which tracks whether trading volume is accumulating on rising or falling days.
The MACD is marginally positive by the supplied signal, despite both the MACD and signal lines standing at -0.005 and the histogram at zero. That points to momentum no longer deteriorating as quickly, rather than a confirmed upward turn. As shown in the momentum chart, the indicators do not yet align behind a clear reversal.
Momentum chart of ThaiBev: RSI(14), MACD, Stochastic. Data: exchange.
Advertisement
Volatility, Volume & Key Levels
The Bollinger Bands are tightly grouped: the upper band is S$0.44, the middle S$0.43 and the lower S$0.42. The band width is 3.7%, while %B at 17% places the price in the lower part of the band. A squeeze means recent price swings have narrowed; it can precede a larger move, but it does not predict its direction.
Trading participation offers little confirmation either way. Volume was 3,197,200 shares, just 0.4 times the 20-day average of 8,234,220, while OBV is falling. Thin turnover makes the unchanged close less persuasive as evidence that selling pressure has eased. ATR, a measure of typical price movement, is S$0.01, or 1.8% of the share price, indicating moderate volatility.
The immediate technical range is exceptionally tight: support is S$0.43 and resistance is S$0.44. A move above S$0.44 would challenge the 50-day average and upper Bollinger Band, while failure at S$0.43 would expose S$0.42, the three-month low and lower band. These are conditional levels, not signals that either move is assured.
Advertisement
Technical Verdict: HOLD (wait & see)
The indicators support a wait-and-see reading: the falling 20-day average and price below the 50-day average keep the trend weak; low Bollinger %B and the squeeze show that price is near support with room for a breakout; and MACD’s marginally positive signal is not confirmed by volume or OBV. The HOLD verdict is invalidated if the price falls below S$0.42, the three-month low.
- Ideal entry range: S$0.42–S$0.43, around the lower Bollinger Band and nearby support.
- Exit target: S$0.44, the 50-day average and immediate resistance.
- Stop-loss protection: Below S$0.42, where the three-month floor would have failed.
For non-traders, the chart is showing a weak share price near support, but not yet a reliable signal that selling has ended.
Indicator
Reading
Last price
S$0.43
5-day change
-1.16%
SMA20 / SMA50
S$0.43 / S$0.44
Bollinger upper / middle / lower
S$0.44 / S$0.43 / S$0.42
RSI / Stochastic
31.5 / 33.3 and 27.8
MACD / signal / histogram
-0.005 / -0.005 / 0.000
Volume / 20-day average
3,197,200 / 8,234,220
20-day support / resistance
S$0.43 / S$0.44
Three-month high / low
S$0.47 / S$0.42
Advertisement
Summary Data ThaiBev
Last price
0.43 SGD
Change 1 day / 5 days / 1 month
0.00% / -1.16% / -1.16%
Trend / MA-cross
downtrend / none
SMA20 / SMA50
0.43 / 0.44
RSI (14) / Stochastic %K
31.5 / 33.3
Bollinger %B / ATR
17% / 0.01
Support / Resistance 20 days
0.43 / 0.44
Data as of
20 October 2026 16:04 WIB
Disclaimer: This technical analysis is generated automatically from exchange data (via Yahoo Finance) and indicators calculated by JournalArta, for information and education only. The verdict and the entry, target and stop-loss levels are not investment advice or a solicitation to buy or sell any security. Investment decisions and their risks rest solely with the reader.