GE Stock Technicals: Drops 3.67% on Tuesday, Testing Support Level
On October 20, 2026: price 299.87 USD, trend downtrend, RSI 34.8, support 299.87, resistance 327.09. technical analysis of ge stock.
By matthew jonathan
October 21, 20264 min read
Advertisement
GE Stock Technicals
Why GE is in focus today
One-day move of -3.67%, about 1.5× its average daily range (ATR)
Volume at 2.1× the 20-day average
Trading near its 3-month low (294.22)
Downtrend extending (5-day change -2.52%)
Selected automatically from 30 NYSE (US) stocks by a technical-signal score with daily weighted randomisation — not a recommendation.
GE Aerospace shares fell 3.67% to $299.87 on Oct. 21, extending a five-day decline as trading volume surged to more than twice its 20-day average. The move puts the stock near its three-month low, making the key question whether buyers will defend the recent floor or the prevailing downtrend will deepen.
Trend & Price Action
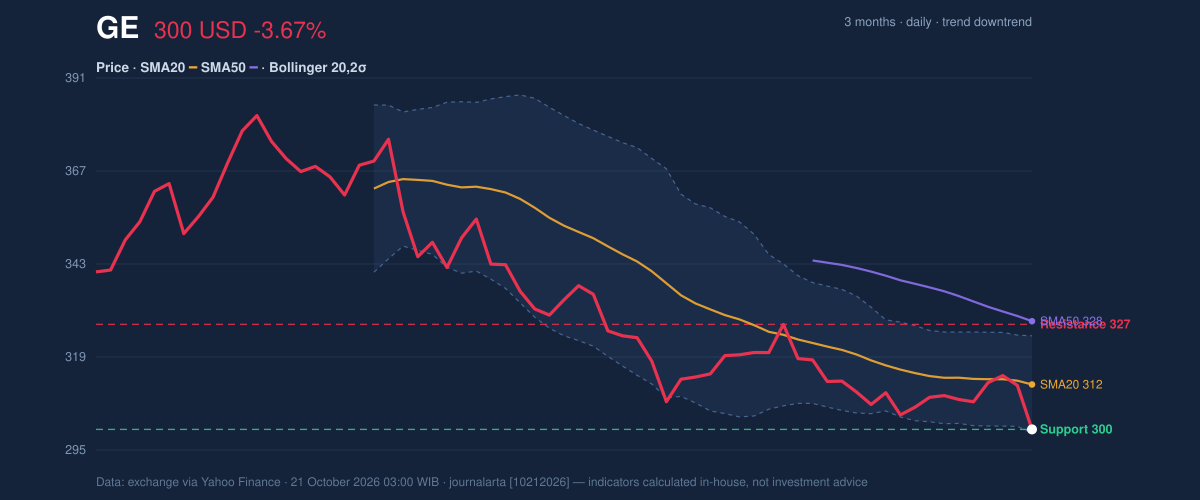
The shares are below both the 20-day simple moving average, at $311.52, and the 50-day average, at $327.93. The 20-day average is also sloping down, while the stock has lost 6.06% over one month. Together, those readings show a weakening price structure rather than a brief pullback within a rising trend. No new moving-average crossover has formed.
GE is sitting at the bottom of its 20-trading-day range, with support at $299.87 and resistance at $327.09. It is also close to the three-month low of $294.22. That proximity matters: a sustained hold near support could signal that selling pressure is easing, but a break below the recent low would leave the chart without a nearby floor in the supplied data.
As shown in the chart, the price is also near the lower Bollinger Band, at $298.92. Bollinger Bands plot a moving average and bands that widen or narrow with price volatility; a reading near the lower band indicates the stock is trading near the bottom of its recent statistical range, not that a rebound is assured. The band width is a normal 8.1%, so the data do not point to an unusually compressed setup or a volatility breakout.
3-month price action chart of GE: price, SMA20/50, Bollinger, support & resistance. Data: exchange.
Advertisement
Momentum & Participation
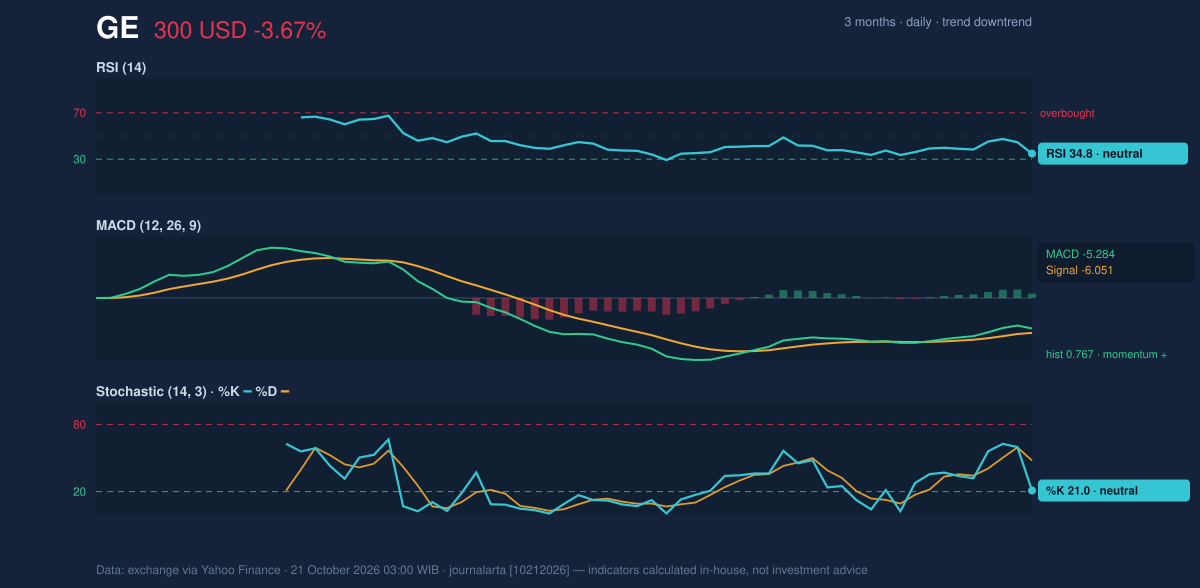
Momentum measures are mixed. The RSI is 34.8, classified as neutral in the supplied data, placing it below the midpoint of its scale but not in the stated oversold category. The Stochastic is also neutral, with %K at 21.0 and %D at 47.8. The gap between the two lines is consistent with weak near-term momentum, though it does not by itself confirm a turn.
The MACD histogram is positive at 0.767, with MACD at -5.284 and its signal line at -6.051. A positive histogram means MACD has moved above its signal line, suggesting short-term momentum has improved. But both MACD readings remain below zero, and that tentative improvement sits against a broader falling trend. It is a counter-signal, not yet a change in the larger price structure.
Momentum chart of GE: RSI(14), MACD, Stochastic. Data: exchange.
Trading volume was 9,217,600 shares, or 2.1 times the 20-day average. A jump in activity can indicate that a move has attracted wider participation; here, the decline in on-balance volume (OBV), a cumulative measure that tracks whether volume accompanies rising or falling sessions, points to net selling pressure rather than clear accumulation. The 3.67% daily drop was about 1.5 times the average daily range implied by the ATR, while the ATR itself is 2.5% of the share price, indicating moderate volatility.
Advertisement
Key Levels & Scenarios
The immediate test is whether GE can hold the $299.87 20-day support area and remain above the three-month low at $294.22. A break below $294.22 would weaken the case that the recent decline is stabilizing. On the upside, a recovery would first encounter the 20-day average at $311.52, followed by resistance at $327.09; the 50-day average at $327.93 is another overhead barrier.
Technical Verdict: HOLD (wait & see)
The verdict reflects three conflicting signals: the falling trend and price below both moving averages remain bearish; the positive MACD histogram suggests short-term momentum may be improving; and the volume surge, alongside falling OBV, shows that selling pressure remains significant. The verdict is invalidated if the price falls below $294.22, the three-month low.
Ideal Entry Range: $298.92–$299.87, based on the lower Bollinger Band and 20-day support.
Exit Target (Target Price): $311.52–$327.09, spanning the 20-day average and 20-day resistance.
Stop Loss: Below $294.22, the three-month low.
Advertisement
For non-traders, the chart shows a stock under pressure but with a short-term momentum signal that has not yet overcome the broader decline.
Indicator
Reading
Last price
$299.87
Daily change
-3.67%
SMA20 / SMA50
$311.52 / $327.93
RSI(14)
34.8 (neutral)
MACD / signal / histogram
-5.284 / -6.051 / 0.767
Volume vs. 20-day average
9,217,600 vs. 4,338,755
20-day support / resistance
$299.87 / $327.09
Summary Data GE
Last price
299.87 USD
Change 1 day / 5 days / 1 month
-3.67% / -2.52% / -6.06%
Trend / MA-cross
downtrend / none
SMA20 / SMA50
311.52 / 327.93
RSI (14) / Stochastic %K
34.8 / 21.0
Bollinger %B / ATR
4% / 7.35
Support / Resistance 20 days
299.87 / 327.09
Data as of
21 October 2026 03:00 WIB
Disclaimer: This technical analysis is generated automatically from exchange data (via Yahoo Finance) and indicators calculated by JournalArta, for information and education only. The verdict and the entry, target and stop-loss levels are not investment advice or a solicitation to buy or sell any security. Investment decisions and their risks rest solely with the reader.