On October 20, 2026: price 50.64 USD, trend downtrend, RSI 23.9, support 50.39, resistance 56.70. technical analysis of bac stock.
By matthew jonathan
October 21, 20264 min read
Advertisement
BAC RSI Oversold
For international investors, Bank of America’s latest share price pairs a sharp short-term retreat with a reading that suggests selling has become stretched: the stock closed at $50.64, while its 14-day Relative Strength Index fell to 23.9, an oversold level. Data from the exchange, as of October 21, 2026, show BAC up 0.50% on the day but down 6.15% over five trading days and 9.89% over one month. The tension is the story: the shares are technically weak, yet already close to a key support zone.
Trend & Price Action
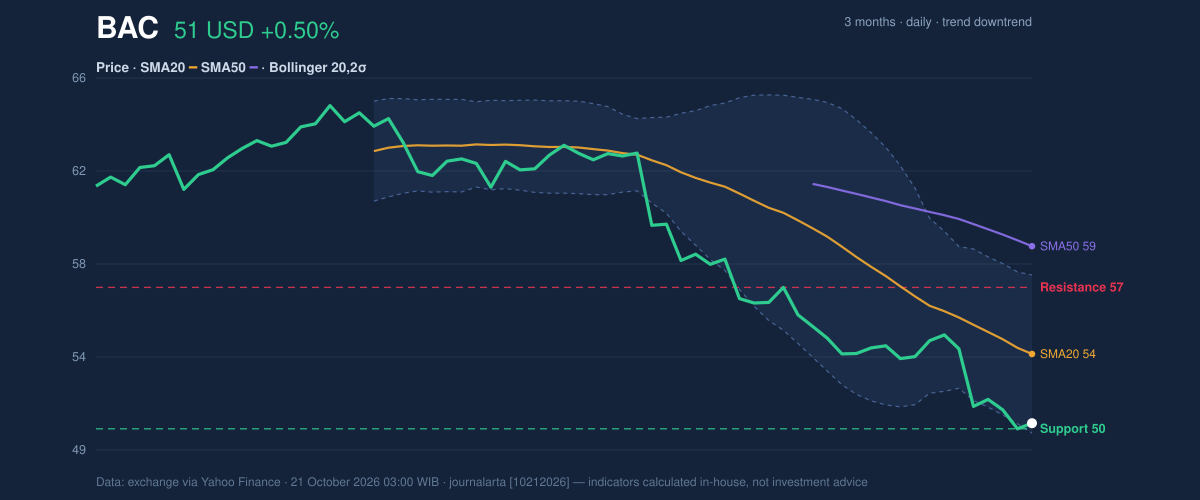
BAC remains in a downtrend. Its price is below both the 20-day simple moving average (SMA), at $53.73, and the 50-day SMA, at $58.53. A moving average smooths daily price changes to show the broader direction; trading below both suggests recent weakness is not confined to a single session. The 20-day average is also falling, with its slope down 2.95% over five trading days. No new crossover between the averages has formed, so there is no fresh technical signal that the trend has turned.
The share price is close to the lower edge of its recent range. The 20-day support is $50.39, compared with resistance at $56.70; BAC is only 4% into that range from the bottom. Its three-month high and low were $65.23 and $49.26, respectively, placing the latest close much nearer the low. That positioning makes support more consequential: holding it could slow the decline, while a break would put the recent three-month low in focus.
The Bollinger Bands, which track price relative to a rolling average and its volatility, reinforce the stretched reading. BAC’s %B is 6%, near the lower band at $50.20, while the upper band is $57.25. The band width is 13.1%, described as normal rather than unusually tight or wide. This points to weakness near the lower boundary, but not to a volatility squeeze that would by itself signal an imminent breakout.
3-month price action chart of BAC: price, SMA20/50, Bollinger, support & resistance. Data: exchange.
Advertisement
Oscillators & Momentum
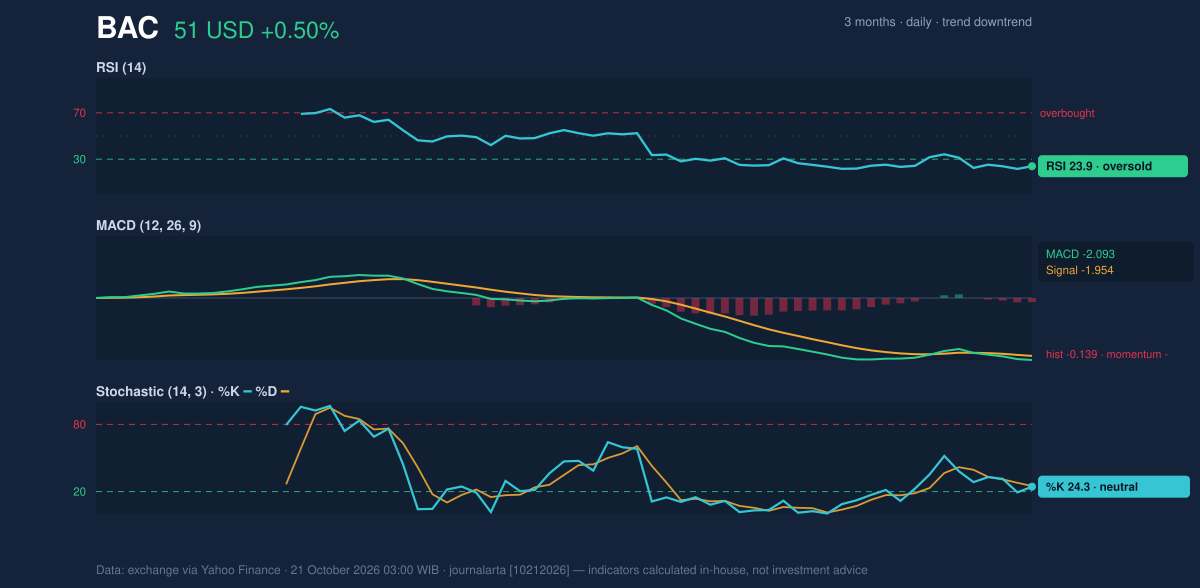
The RSI at 23.9 is oversold, meaning the decline has been unusually persistent relative to recent gains. That can precede a pause or rebound, but it is not confirmation of one. The Stochastic oscillator is less emphatic: %K at 24.3 and %D at 25.0 are neutral, offering no clear bullish turn. The two measures therefore describe a market under pressure, with one showing an extreme but neither establishing that buyers have regained control.
The MACD, a trend-momentum measure comparing short- and longer-term price averages, remains negative. Its reading is -2.093, below the signal line at -1.954, and the histogram is -0.139. That configuration indicates downward momentum is still in place. In practical terms, the oversold RSI raises the possibility of a relief bounce, while MACD cautions that the prevailing trend has not yet confirmed a reversal.
Momentum chart of BAC: RSI(14), MACD, Stochastic. Data: exchange.
Volatility, Volume & Key Levels
Trading volume was 43.6 million shares, close to the 20-day average of 43.0 million, or roughly normal activity. The decline therefore did not occur on unusually thin trading. On-balance volume (OBV), an indicator that accumulates volume on rising sessions and subtracts it on falling ones, is also down. That direction offers no sign that buying participation is quietly building beneath the price weakness.
Average True Range, a measure of typical daily movement, stands at $1.33, or 2.6% of the share price: moderate volatility by the supplied data. The immediate test is support at $50.39, with the lower Bollinger Band at $50.20 nearby. If BAC holds that area and momentum improves, resistance at $56.70 becomes the next important hurdle. A sustained move below support would instead weaken the case for a near-term stabilization and expose the three-month low of $49.26.
Advertisement
Technical Verdict: HOLD
HOLD (wait & see) best reflects conflicting signals rather than a confirmed turn. The RSI is oversold, but MACD remains negative and below its signal line; meanwhile, the falling 20-day SMA and declining OBV show that the broader trend still leans lower. The verdict is invalidated if the price falls below $50.39, the stated 20-day support.
Indicative entry range: $50.20–$53.73, bounded by the lower Bollinger Band and 20-day SMA.
Indicative exit target: $56.70, the stated 20-day resistance.
Stop-loss reference: Below $50.20, the lower Bollinger Band; a break would signal that support has failed.
In plain English, the chart shows a weak trend that may be stretched, but it has not yet supplied clear evidence that the decline has ended.
Data: exchange figures, as of October 21, 2026, 03:00 WIB.
Why BAC is in focus today
RSI(14) at 23.9 — oversold zone
Downtrend extending (5-day change -6.15%)
Selected automatically from 30 NYSE (US) stocks by a technical-signal score with daily weighted randomisation — not a recommendation.
Advertisement
Summary Data BAC
Last price
50.64 USD
Change 1 day / 5 days / 1 month
0.50% / -6.15% / -9.89%
Trend / MA-cross
downtrend / none
SMA20 / SMA50
53.73 / 58.53
RSI (14) / Stochastic %K
23.9 / 24.3
Bollinger %B / ATR
6% / 1.33
Support / Resistance 20 days
50.39 / 56.70
Data as of
21 October 2026 03:00 WIB
Disclaimer: This technical analysis is generated automatically from exchange data (via Yahoo Finance) and indicators calculated by JournalArta, for information and education only. The verdict and the entry, target and stop-loss levels are not investment advice or a solicitation to buy or sell any security. Investment decisions and their risks rest solely with the reader.