VZ Stock Technicals: Drops 1.43% on Monday, Momentum Weakens
On October 19, 2026: price 44.15 USD, trend downtrend, RSI 40.4, support 41.65, resistance 47.32. technical analysis of vz stock.
By matthew jonathan
October 20, 20264 min read
Advertisement
VZ Stock Technicals
Verizon fell 1.43% to $44.15 on the NYSE, extending a one-month decline even as the stock remained higher over five trading days. The mixed time frames point to a short-term rebound within a broader weakening trend: the latest price is below both its 20-day and 50-day moving averages, while subdued volume offers little confirmation that buyers are taking control.
Trend & Price Action
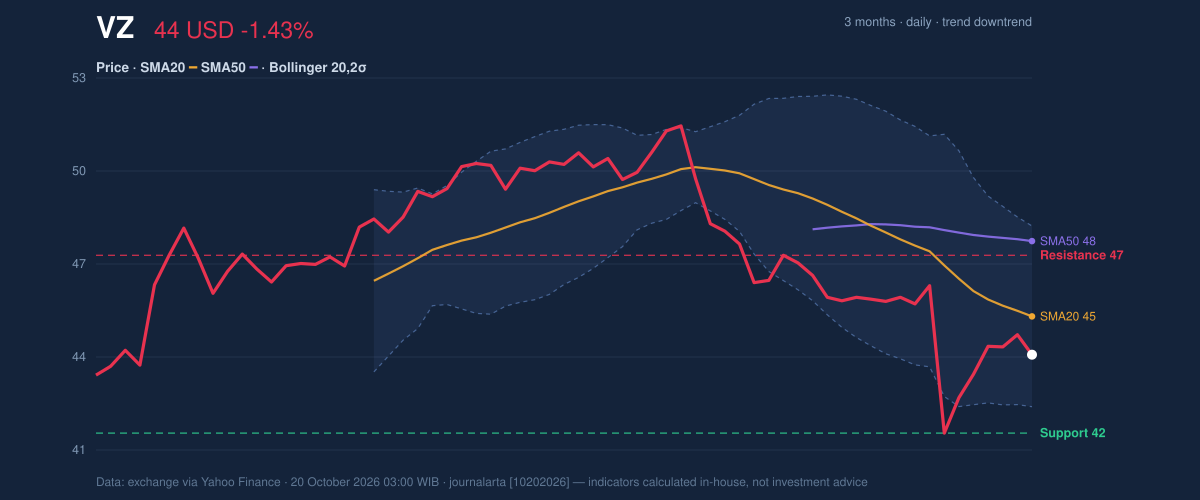
Verizon’s five-day gain of 3.20% has not reversed its 7.40% monthly loss. At $44.15, the shares sit below the 20-day simple moving average (SMA) of $45.37 and the 50-day SMA of $47.78. The 20-day average is also falling, down 2.58% over five days. That combination means the recent bounce is running against a downward-sloping near-term trend, rather than confirming a sustained change in direction.
There has been no new moving-average crossover, so the averages provide no fresh reversal signal. Verizon is 44% of the way through its 20-trading-day range, between $41.65 support and $47.32 resistance. The three-month high and low, $51.67 and $40.81, respectively, show that the stock has retreated substantially from its peak but remains above the period low.
As shown in the chart, the price is below the middle Bollinger band at $45.37, with the lower band at $42.49 and upper band at $48.26. Bollinger bands track price variation around an average; a reading of 29% for %B places the share closer to the lower band than the upper one, but not at the band’s floor. The band width is 12.7%, described as normal, so the data do not indicate an unusually compressed or sharply expanding volatility range.
3-month price action chart of VZ: price, SMA20/50, Bollinger, support & resistance. Data: exchange.
Advertisement
Oscillators & Momentum
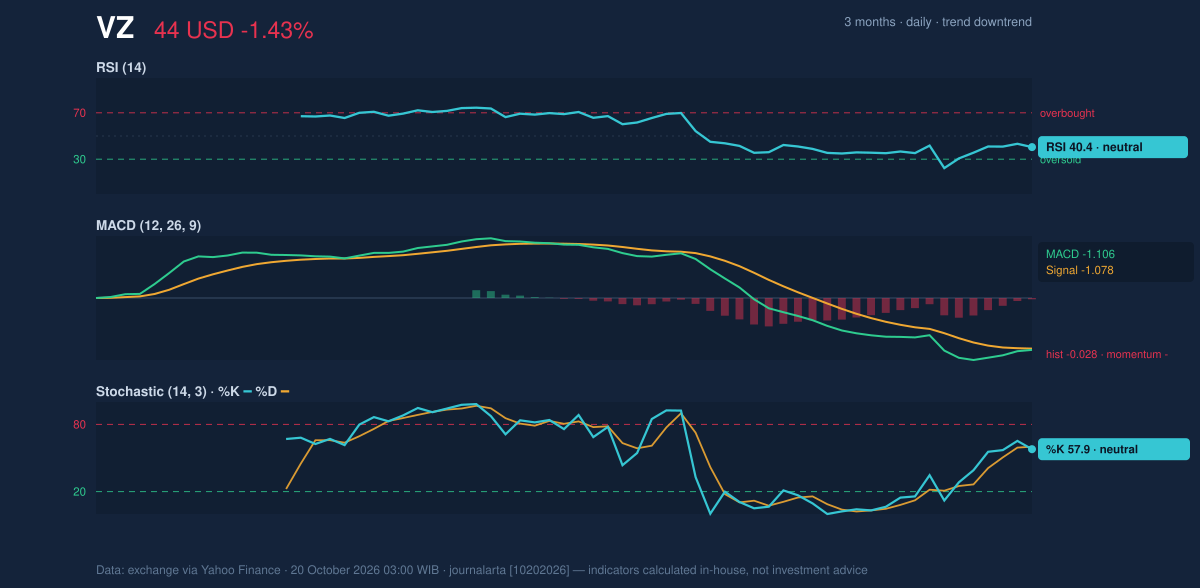
Momentum indicators are subdued rather than decisively oversold. The 14-day Relative Strength Index (RSI), a measure of the pace of recent gains and losses, is 40.4, in neutral territory. The Stochastic readings are also neutral: %K at 57.9 and %D at 60.1. Their proximity suggests neither a strong acceleration in buying nor a clear oversold signal that would, by itself, imply an imminent rebound.
The MACD, a trend-and-momentum measure, remains slightly negative: -1.106 against a signal line of -1.078, leaving a histogram of -0.028. The narrow gap indicates only modest negative momentum, but its direction still fails to confirm the five-day rise. RSI and Stochastic are neutral, while MACD remains marginally negative—a mixed picture consistent with a tentative bounce, not a confirmed trend reversal.
Momentum chart of VZ: RSI(14), MACD, Stochastic. Data: exchange.
Volatility, Volume & Key Levels
Average True Range (ATR), which estimates typical price movement, is $1.18, or 2.7% of the share price, indicating moderate volatility. That makes the gap between the current price and nearby technical levels meaningful: the lower Bollinger band at $42.49 is above the 20-day support at $41.65, while the 20-day resistance at $47.32 lies below the 50-day average at $47.78. A rise through resistance would therefore encounter another overhead reference soon after; a failure to hold the lower band would put the stated support level in focus.
Trading participation is weak. Latest volume of 16.1 million shares was about 0.6 times the 20-day average of 25.7 million, and on-balance volume (OBV)—a running measure of buying and selling pressure inferred from volume—was falling. The low volume and declining OBV do not confirm the recent five-day gain. If the stock can move above $47.32 and sustain that level, the price would challenge the 50-day average; if it falls through $42.49, the $41.65 support becomes the next stated level to watch.
Advertisement
Technical Verdict: HOLD (wait & see)
The technical picture supports a wait-and-see verdict: Verizon remains below declining short-term trend measures, MACD is negative, and falling OBV alongside thin volume weakens confidence in the recent rebound. Neutral RSI and Stochastic readings, plus a price still above the lower Bollinger band and stated support, argue against treating the indicators as an unequivocal breakdown signal.
- Ideal entry range: $42.49–$44.15, bounded by the lower Bollinger band and the latest price.
- Exit target: $47.32, the 20-trading-day resistance.
- Stop-loss protection: $41.65, the 20-trading-day support.
- Invalidation: The verdict is invalidated if the price falls below $41.65.
For non-traders, the signals are mixed: the stock has bounced recently, but the broader technical trend has not yet turned higher.
| Indicator | Reading |
|---|---:|
| Last price | $44.15 |
| Change | 1 day: -1.43% · 5 days: +3.20% · 1 month: -7.40% |
| SMA20 / SMA50 | $45.37 / $47.78 |
| Bollinger bands | Lower $42.49 · Middle $45.37 · Upper $48.26 · %B 29% |
| RSI(14) | 40.4, neutral |
| Stochastic | %K 57.9 / %D 60.1, neutral |
| MACD / signal / histogram | -1.106 / -1.078 / -0.028 |
| ATR(14) | $1.18 (2.7%) |
| Volume / 20-day average | 16,148,200 / 25,699,940 |
| Support / resistance | $41.65 / $47.32 |
| Three-month high / low | $51.67 / $40.81 |
Source: Exchange data, as of October 20, 2026, 03:00 WIB. Technical analysis is not an investment recommendation.
Advertisement
Summary Data VZ
Last price
44.15 USD
Change 1 day / 5 days / 1 month
-1.43% / 3.20% / -7.40%
Trend / MA-cross
downtrend / none
SMA20 / SMA50
45.37 / 47.78
RSI (14) / Stochastic %K
40.4 / 57.9
Bollinger %B / ATR
29% / 1.18
Support / Resistance 20 days
41.65 / 47.32
Data as of
20 October 2026 03:00 WIB
Disclaimer: This technical analysis is generated automatically from exchange data (via Yahoo Finance) and indicators calculated by JournalArta, for information and education only. The verdict and the entry, target and stop-loss levels are not investment advice or a solicitation to buy or sell any security. Investment decisions and their risks rest solely with the reader.