On October 19, 2026: price 118.70 USD, trend uptrend, RSI 72.6, support 103.92, resistance 118.81. technical analysis of wmt stock.
By Alistair Sterling
October 20, 20264 min read
Advertisement
RSI Overbought, WMT Stock Drops 0.09% on Monday
Walmart is approaching its three-month high as a fresh moving-average crossover and a sharp five-day advance meet overbought momentum, putting the stock near a test of resistance. Shares were at $118.70 on the NYSE, down 0.09% on the day, according to market data as of October 20, 2026, at 03:00 WIB. The setup matters beyond the United States: Walmart’s scale makes its share price a closely watched barometer for a major global retailer, even as these technical signals describe trading conditions rather than business fundamentals.
Trend & Price Action
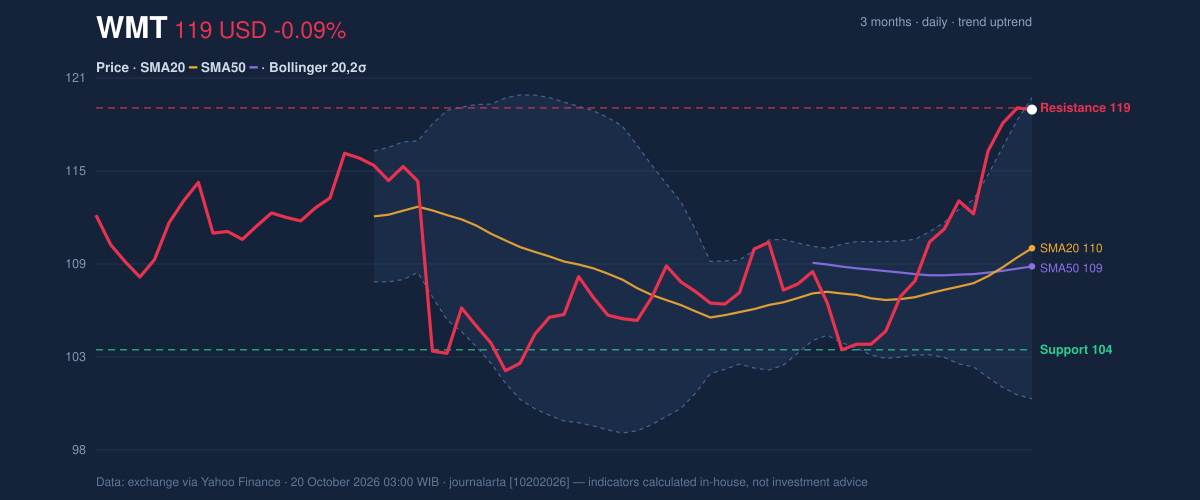
Walmart has gained 4.97% over five trading days and 10.48% over one month. The short-term trend is rising, with the SMA20 — the average closing price over 20 trading days — climbing 2.19% over five days. At $118.70, the share price is well above the SMA20 at $110.17 and SMA50 at $109.05, while the 20-day average has crossed above the 50-day average. This “golden cross” often signals that recent price strength is broadening across a longer period, though it can also lag a rapid rally.
The stock is near the top of its recent trading range: it sits at 99% of the 20-day range, with resistance at $118.81. Its three-month high is $121.38, only modestly above the current price. That proximity means further gains would need to push through nearby supply — the point where some holders may choose to sell — rather than merely confirm an established uptrend.
The Bollinger Bands, which frame typical price movement around a moving average, run from $100.90 to $119.44. With the price near the upper band and %B at 96%, Walmart is pressing the top of its recent statistical range. The band width of 16.8% is classified as normal, not unusually tight; this is not a classic low-volatility squeeze that would by itself signal an impending breakout.
3-month price action chart of WMT: price, SMA20/50, Bollinger, support & resistance. Data: exchange.
Advertisement
Oscillators & Momentum
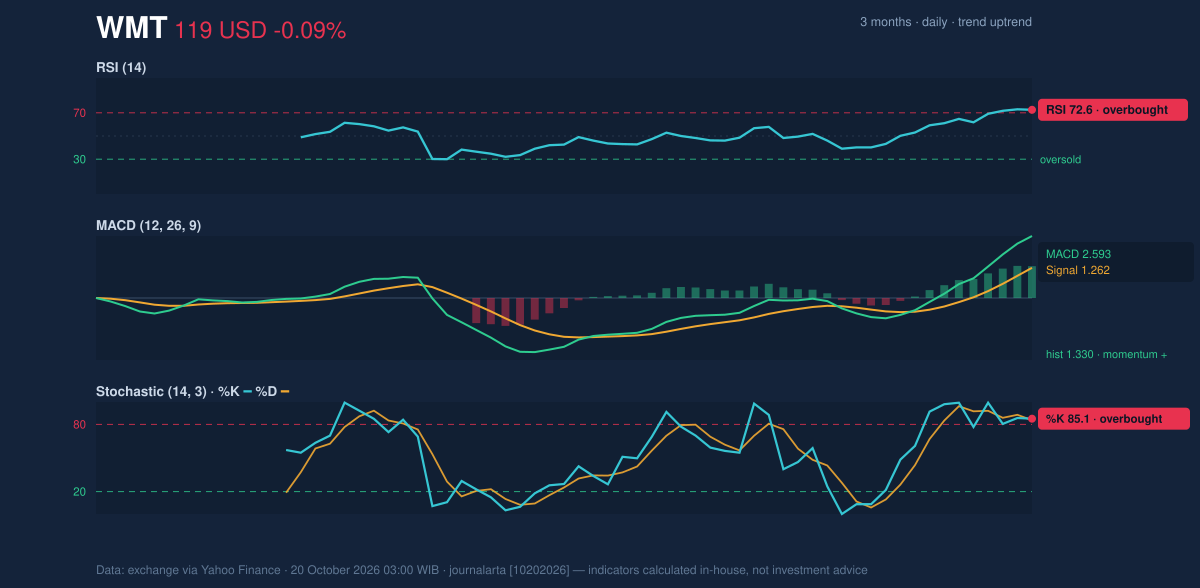
Momentum indicators confirm the upward move, but they also show that the rally is stretched. The RSI is 72.6, in overbought territory; the Stochastic readings are also overbought, with %K at 85.1 and %D at 83.8. These measures compare recent gains with losses or place the latest close within a recent range. They do not establish that a reversal is imminent, but they suggest the stock may have less room to rise without pauses or pullbacks.
MACD, a trend-following measure that compares moving averages, remains positive: the MACD is 2.593, above its 1.262 signal line, with a positive histogram of 1.330. That positive MACD supports the trend, while RSI and Stochastic warn that near-term momentum is crowded. Together, the indicators describe an advance with real upward force, but one where chasing the latest move carries greater risk of a short-term setback.
Momentum chart of WMT: RSI(14), MACD, Stochastic. Data: exchange.
Volatility, Volume & Key Levels
The average true range (ATR) is $2.38, about 2.0% of the share price, indicating moderate day-to-day movement. Volume was 16.26 million shares, compared with a 20-day average of 21.32 million — roughly 0.8 times normal. That lighter participation tempers the strength of the latest move: price has risen, but trading activity has not matched its usual pace. On the other hand, rising on-balance volume (OBV), which tracks whether volume accompanies buying or selling pressure, suggests accumulation has been increasing.
A sustained move above $118.81 resistance would put the three-month high at $121.38 in focus as the next reference point in the supplied data. If the price fails to hold its current area, the rising SMA20 at $110.17 is a nearer trend reference; the broader 20-day support is $103.92. A break below that support would challenge the current technical picture. These are conditional levels, not predictions.
Advertisement
Technical Verdict: HOLD (wait & see)
The indicators pull in opposite directions: the golden cross, rising averages, positive MACD and climbing OBV support the trend, while overbought RSI and Stochastic readings, a price near resistance, and below-average volume argue for caution. The verdict is invalidated if the price falls below $103.92, the stated 20-day support.
Ideal Entry Range: $110.17–$118.81, bounded by the SMA20 and current resistance; the lower end is a trend reference, not a guaranteed floor.
Exit Target: $121.38, the three-month high and next supplied resistance reference.
Stop Loss: $103.92, the 20-day support level used to define invalidation.
In plain English, Walmart’s trend is still upward, but the indicators show a crowded rally that has not yet cleared nearby resistance.
Why WMT is in focus today
Fresh golden cross: SMA20 crossed above SMA50
RSI(14) at 72.6 — overbought zone
Uptrend confirmed (5-day change 4.97%)
Selected automatically from 30 NYSE (US) stocks by a technical-signal score with daily weighted randomisation — not a recommendation.
Advertisement
Summary Data WMT
Last price
118.70 USD
Change 1 day / 5 days / 1 month
-0.09% / 4.97% / 10.48%
Trend / MA-cross
uptrend / golden
SMA20 / SMA50
110.17 / 109.05
RSI (14) / Stochastic %K
72.6 / 85.1
Bollinger %B / ATR
96% / 2.38
Support / Resistance 20 days
103.92 / 118.81
Data as of
20 October 2026 03:00 WIB
Disclaimer: This technical analysis is generated automatically from exchange data (via Yahoo Finance) and indicators calculated by JournalArta, for information and education only. The verdict and the entry, target and stop-loss levels are not investment advice or a solicitation to buy or sell any security. Investment decisions and their risks rest solely with the reader.