CCB Stock Technicals: Drops 1.10% on Friday, Testing Key Resistance
On October 16, 2026: price 9.87 HKD, trend uptrend, RSI 57.5, support 9.51, resistance 9.98. technical analysis of ccb stock.
By Elena Vance
October 19, 20264 min read
Advertisement
CCB Stock Technicals
Why CCB is in focus today
Trading near its 3-month high (9.99)
Uptrend confirmed (5-day change 1.34%)
Selected automatically from 16 HKEX (Hong Kong) stocks by a technical-signal score with daily weighted randomisation — not a recommendation.
China Construction Bank is trading near its three-month high, with a rising five-day trend putting the Hong Kong-listed stock close to a test of resistance. Shares were at HK$9.87 on Oct. 16, down 1.10% on the day but up 1.34% over five trading days, according to market data from the exchange. For international investors, the tension is clear: the trend is positive, but the stock is approaching a level where further gains may need stronger confirmation.
Advertisement
Trend & Price Action
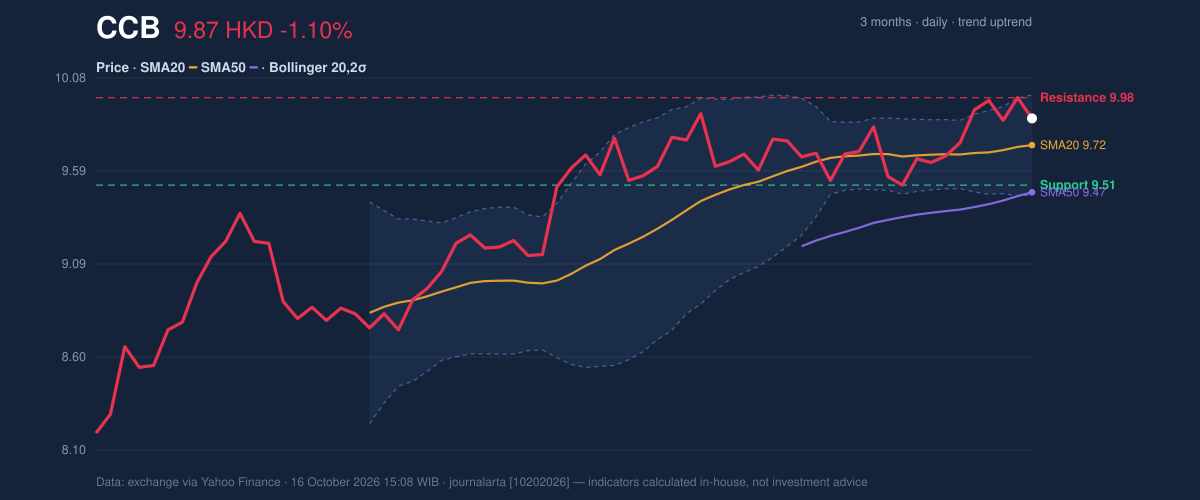
3-month price action chart of CCB: price, SMA20/50, Bollinger, support & resistance. Data: exchange.
The price remains above its 20-day and 50-day moving averages, at HK$9.72 and HK$9.47 respectively. The 20-day average is rising, while no new crossover has formed. That combination suggests an established upward bias rather than a fresh acceleration: recent prices are stronger than their short-term and intermediate-term averages, but there is no new moving-average signal to mark a change in trend.
The stock sits about 76% of the way through its 20-trading-day range, between support at HK$9.51 and resistance at HK$9.98. It is also close to its three-month high of HK$9.99. That makes the upper boundary especially important: a sustained move through it would show that buyers can absorb selling near the recent peak, while a retreat would leave the share price within its existing range.
As shown in the chart, the rising averages and the price’s position in the range frame the next test. The Bollinger bands—bands drawn around a moving average to show price dispersion—are narrowing, a squeeze that often precedes a larger move but does not indicate its direction.
[ GRAFIK-HARGA]
Advertisement
Oscillators & Momentum
Momentum readings broadly support the rising trend, without showing an extreme reading. The RSI is 57.5, a neutral reading; the Relative Strength Index measures the pace of recent gains and losses, and this level is consistent with upward pressure that has not become notably stretched.
The Stochastic oscillator, which compares the latest close with its recent trading range, is also classified as neutral, with %K at 76.6 and %D at 85.3. The gap between the two lines warrants attention, but the supplied readings alone do not establish a confirmed reversal. Meanwhile, MACD is positive at 0.112, above its 0.103 signal line, and its histogram stands at 0.009. The Moving Average Convergence Divergence indicator compares moving averages to gauge momentum; here, it points to modest positive momentum rather than a decisive surge.
[ GRAFIK-MOMENTUM]
Volatility & Volume
The Bollinger band width is 5.5%, and the bands are narrowing. With price at 77% of the band’s range, it is positioned in the upper half but remains below the upper band at HK$9.99. The squeeze means recent price variation has contracted; it raises the possibility of a breakout or a sharper pullback, but price action must determine which.
Average True Range, a measure of typical trading movement, is HK$0.18, or 1.8% of the share price, indicating moderate volatility. Volume was 183.1 million shares, about 1.1 times its 20-day average, while On-Balance Volume (OBV)—a running measure that combines price direction and volume—was rising. That adds evidence of participation behind the advance, although one above-average session does not by itself confirm a lasting breakout.
Advertisement
Key Levels & Scenarios
The immediate test is HK$9.98–HK$9.99, the 20-day resistance and three-month high area. A break above that zone would be technically more convincing if accompanied by continued positive momentum and volume. If the stock fails there, HK$9.72, the 20-day average, is the first nearby reference; a deeper pullback would bring the 20-day support at HK$9.51 into focus, followed by the 50-day average at HK$9.47.
The lower Bollinger band is HK$9.46, close to the 50-day average. A fall below that cluster would weaken the current upward structure more clearly than a routine retreat from resistance. The three-month low of HK$8.18 is a much wider historical reference, not the immediate support implied by the current indicators.
Technical Verdict: HOLD (wait & see)
HOLD (wait & see) reflects a rising trend and positive MACD, balanced against resistance just above the current price and a Bollinger squeeze that has yet to resolve. The verdict is invalidated if the share price falls below HK$9.46, the lower band and nearby 50-day-average area.
- Ideal entry range: HK$9.51–HK$9.72, around 20-day support and the 20-day moving average.
- Exit target: HK$9.98–HK$9.99, the resistance and three-month-high area.
- Stop-loss protection: Below HK$9.46, the lower Bollinger band.
For non-traders, the indicators describe a stock with a mild upward bias, but one that has yet to clear its nearby ceiling.
Indicator
Reading
Last price
HK$9.87
Daily change
-1.10%
Five-day change
+1.34%
SMA20 / SMA50
HK$9.72 / HK$9.47
RSI (14)
57.5
MACD / signal
0.112 / 0.103
20-day support / resistance
HK$9.51 / HK$9.98
Three-month high / low
HK$9.99 / HK$8.18
Advertisement
Summary Data CCB
Last price
9.87 HKD
Change 1 day / 5 days / 1 month
-1.10% / 1.34% / 1.96%
Trend / MA-cross
uptrend / none
SMA20 / SMA50
9.72 / 9.47
RSI (14) / Stochastic %K
57.5 / 76.6
Bollinger %B / ATR
77% / 0.18
Support / Resistance 20 days
9.51 / 9.98
Data as of
16 October 2026 15:08 WIB
Disclaimer: This technical analysis is generated automatically from exchange data (via Yahoo Finance) and indicators calculated by JournalArta, for information and education only. The verdict and the entry, target and stop-loss levels are not investment advice or a solicitation to buy or sell any security. Investment decisions and their risks rest solely with the reader.