On October 16, 2026: price 224.99 USD, trend uptrend, RSI 70.8, support 202.41, resistance 224.99. technical analysis of cvx stock.
By Elena Vance
October 19, 20264 min read
Advertisement
RSI Overbought, CVX Stock Gains 2.59% on Friday
Why CVX is in focus today
One-day move of 2.59%, about 1.3× its average daily range (ATR)
Trading near its 3-month high (225.31)
RSI(14) at 70.8 — overbought zone
Uptrend confirmed (5-day change 6.14%)
Selected automatically from 30 NYSE (US) stocks by a technical-signal score with daily weighted randomisation — not a recommendation.
Chevron shares rose 2.59% to $224.99 in the latest session, putting the oil major near its three-month high as the five-day gain reached 6.14%. The move was about 1.3 times the stock’s average daily trading range, while volume ran at 1.2 times its 20-day average, according to market data from the exchange. That combination points to an advance attracting stronger-than-usual participation—but also leaves the shares stretched after a rapid rise.
Advertisement
Trend & Price Action
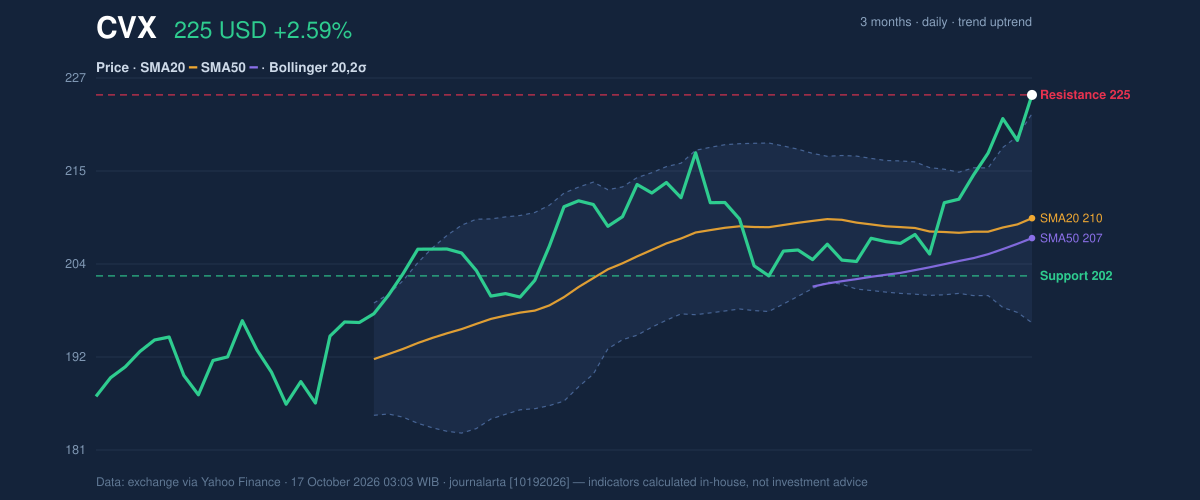
CVX is above both its 20-day simple moving average, or SMA, at $209.61 and its 50-day SMA at $207.13. The 20-day average is rising, up 0.88% over five trading days, reinforcing the short-term uptrend. There has been no fresh moving-average crossover, so the signal comes from the price holding above both averages rather than a new trend trigger.
The shares closed at the 20-day resistance level of $224.99, the top of the stated trading range, and sit just below the three-month high of $225.31. That leaves little room before the recent peak becomes a test: a sustained move above it would show the advance is extending, while a failure there could prompt traders to focus on whether nearer-term support holds. As shown in the chart, price has also moved above the upper Bollinger Band, a sign of unusually strong short-term momentum rather than a guarantee that gains will continue.
3-month price action chart of CVX: price, SMA20/50, Bollinger, support & resistance. Data: exchange.
Advertisement
Oscillators & Momentum
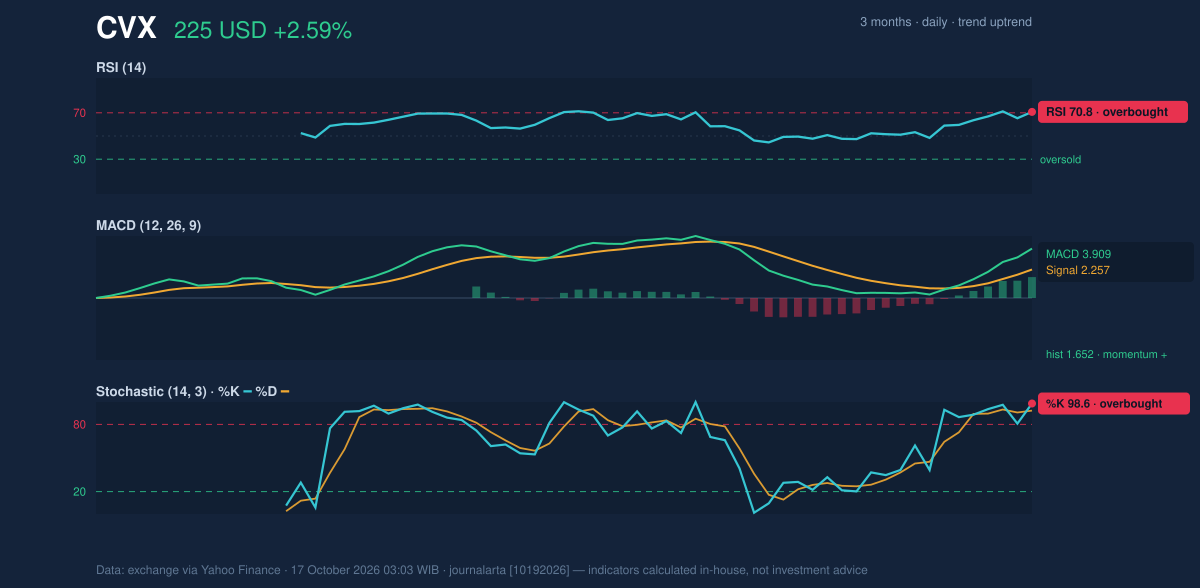
Momentum indicators confirm the strength of the rally but warn that it has become crowded. The RSI is 70.8, in overbought territory, while the Stochastic readings of 98.6 and 92.3 are also overbought. These measures compare recent gains and losses; high readings mean buying has dominated, but they can persist during a strong trend and do not, by themselves, establish that a reversal is underway.
The MACD remains positive: its reading of 3.909 is above its 2.257 signal line, and the positive 1.652 histogram indicates that upward momentum is still in place. The contrast matters. MACD confirms the trend, while RSI and Stochastic show that the pace may be difficult to sustain without pauses or consolidation.
Momentum chart of CVX: RSI(14), MACD, Stochastic. Data: exchange.
Volatility, Volume & Key Levels
The Bollinger %B reading of 109% places CVX above the band’s upper boundary at $222.66. Bollinger Bands map price relative to a moving average and its recent variation; trading above the upper band signals an unusually strong move relative to that recent range. The band width is 12.5%, described as normal, so this is not a squeeze signaling unusually compressed trading. The average true range, or ATR, is $4.50—about 2.0% of the share price—indicating moderate day-to-day movement.
Volume of 8,719,900 shares exceeded the 20-day average of 7,485,850, and rising on-balance volume (OBV) suggests that trading participation has broadly supported the climb. That is a healthier confirmation than a price rise on thin volume, though it does not remove the near-term risk signaled by overbought oscillators.
The main nearby reference is $225.31, the three-month high; the listed 20-day resistance is $224.99, the latest price itself. Below, $209.61, the 20-day SMA, is a first trend reference, with $202.41 as the 20-day support. A retreat toward those levels would test whether the advance is consolidating or losing its structure. The lower Bollinger Band at $196.56 is a wider-range reference, not immediate support.
Advertisement
Technical Verdict: HOLD (wait & see)
HOLD (wait & see) is the clearest technical reading: the trend and trading activity are constructive, but stretched momentum and a price above the upper Bollinger Band make the near-term risk less balanced.
- Reasons: price is above rising SMA20 and SMA50; MACD is positive; volume is above average and OBV is rising.
- Counterweight: RSI and Stochastic are overbought, and price is above the upper Bollinger Band.
- Invalidation: this verdict is invalidated if price falls below $202.41, the stated 20-day support.
- Reference entry range: $209.61–$224.99, bounded by the SMA20 and the stated resistance; this is a technical reference, not a recommendation.
- Reference exit target: $225.31, the three-month high.
- Reference stop-loss level: $202.41, the stated support.
In plain English, the trend is positive, but the shares are close to a recent peak and momentum readings argue for caution.
Data
Market data: exchange, as of 17 October 2026, 03:03 WIB. CVX last price: $224.99; previous close: $219.32. Changes: 2.59% daily, 6.14% over five days, and 7.39% over one month. Technical indicators and levels are calculated from the supplied market data.
Advertisement
Summary Data CVX
Last price
224.99 USD
Change 1 day / 5 days / 1 month
2.59% / 6.14% / 7.39%
Trend / MA-cross
uptrend / none
SMA20 / SMA50
209.61 / 207.13
RSI (14) / Stochastic %K
70.8 / 98.6
Bollinger %B / ATR
109% / 4.50
Support / Resistance 20 days
202.41 / 224.99
Data as of
17 October 2026 03:03 WIB
Disclaimer: This technical analysis is generated automatically from exchange data (via Yahoo Finance) and indicators calculated by JournalArta, for information and education only. The verdict and the entry, target and stop-loss levels are not investment advice or a solicitation to buy or sell any security. Investment decisions and their risks rest solely with the reader.