On October 16, 2026: price 186.03 USD, trend sideways, RSI 46.3, support 183.09, resistance 209.05. technical analysis of pltr stock.
By Elena Vance
October 19, 20265 min read
Advertisement
PLTR Momentum Weakens
Why PLTR is in focus today
One-day move of -7.22%, about 1.8× its average daily range (ATR)
MACD histogram has just turned negative
Selected automatically from 32 NASDAQ (US) stocks by a technical-signal score with daily weighted randomisation — not a recommendation.
A 7.22% drop in Palantir Technologies shares has put the artificial-intelligence software company at a technical crossroads, with heavier-than-usual trading and a newly negative MACD histogram pointing to fading short-term momentum. For international investors, the question is whether the decline is a pause within a broader range or the start of a deeper retreat.
Trend & Price Action
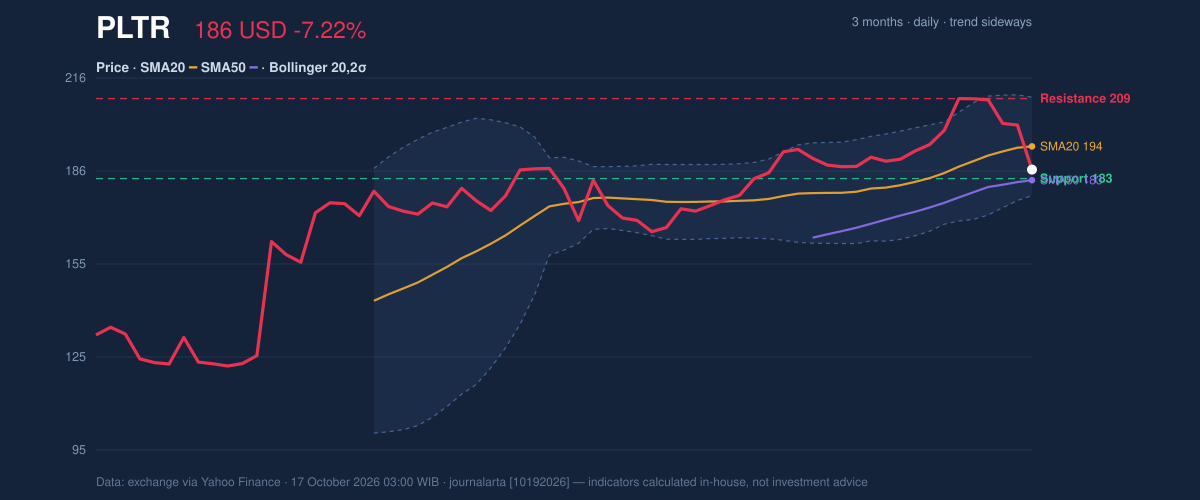
Palantir closed at $186.03 on Nasdaq, down from $200.50 at the previous close, according to market data as of October 17, 2026, 03:00 WIB. The one-day loss was about 1.8 times the stock’s average daily range, measured by its Average True Range (ATR), a gauge of typical price movement. That makes the fall significant, though not by itself proof of a lasting trend change.
The shares are below the 20-day simple moving average (SMA) of $193.55, but above the 50-day SMA of $182.57. This split matters: the shorter-term price structure has weakened, while the longer reference point in this data still provides a potential floor. The broader trend is classified as sideways, and there has been no new moving-average crossover—so the latest decline has not yet confirmed a lasting directional shift.
The stock has risen 4.72% over one month but fallen 11.01% in five trading days. Its 20-day support is $183.09, close to the 50-day average, while resistance is $209.05. At about 11% of the way through that support-to-resistance range, the price is near the lower end. The three-month high and low are $212.94 and $117.89, respectively, showing that the current pullback comes after a much wider period of movement.
The chart helps show whether support is holding relative to the moving averages and Bollinger bands.
3-month price action chart of PLTR: price, SMA20/50, Bollinger, support & resistance. Data: exchange.
Advertisement
Oscillators & Momentum
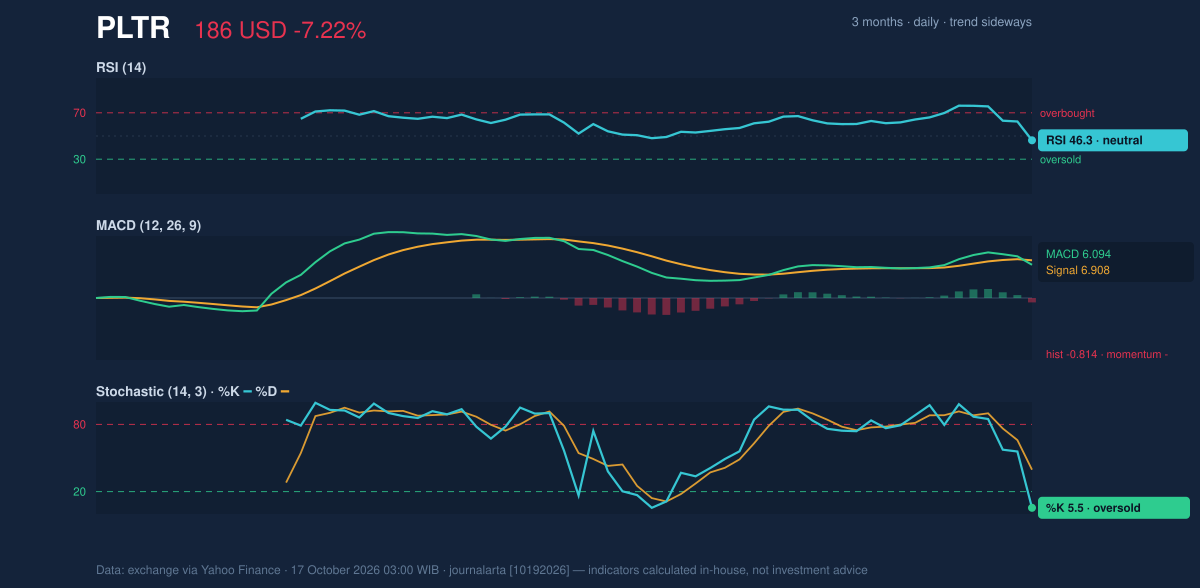
The Relative Strength Index (RSI), which compares recent gains and losses, is 46.3, a neutral reading. It does not indicate that selling has pushed the shares into oversold territory on this measure. The Stochastic oscillator, which compares the latest close with its recent trading range, gives a different signal: %K is 5.5 versus %D at 39.6, an oversold reading. That can accompany a sharp sell-off, but it does not establish that a rebound has begun.
The clearest momentum warning comes from the MACD, a trend-following indicator that compares moving averages. Its histogram has turned negative at -0.814, with the MACD line at 6.094 below its 6.908 signal line. This says downside momentum has recently gained the upper hand; it is especially relevant because the indicator has just crossed into negative territory, rather than remaining negative throughout the period.
The chart places the RSI, MACD and Stochastic readings alongside one another, making their mixed signals easier to compare.
Momentum chart of PLTR: RSI(14), MACD, Stochastic. Data: exchange.
Advertisement
Volatility, Volume & Key Levels
The Bollinger bands, which map price against recent volatility, are at $177.59 on the lower side and $209.51 on the upper side, with a midpoint of $193.55. The price is near the lower band, reflected in a %B reading of 26%, but the band width of 16.5% is described as normal rather than squeezed or sharply expanding. In other words, price has moved toward the lower end of its recent range without a band signal that, on its own, implies an unusually constrained setup.
ATR is $7.48, or 4.0% of the share price, indicating high volatility. The volume data add weight to the decline: 33,253,300 shares traded, about 1.4 times the 20-day average of 23,114,800. Yet On-Balance Volume (OBV), which tracks whether trading volume is flowing more with rising or falling closes, is rising. That divergence complicates the picture: elevated turnover confirms active participation in the drop, while rising OBV does not show broad volume-flow deterioration in the supplied data.
The immediate test is whether the shares can hold $183.09, near the 50-day average. A break below that support would weaken the case that the decline remains contained within the current range; a hold could leave room for stabilization. On any recovery, $193.55 is the first notable reference point, followed by resistance at $209.05. The Bollinger midpoint and upper band offer additional context, not guarantees of a price path.
Advertisement
Technical Verdict: HOLD (wait & see)
HOLD (wait & see) fits the conflicting evidence: the price is below the 20-day average and MACD momentum is negative, but it remains above the 50-day average, the Stochastic is oversold, and OBV is rising. The verdict is invalidated if the price falls below $183.09, the stated 20-day support.
- Ideal entry range: $183.09–$193.55, bounded by 20-day support and the 20-day SMA.
- Exit target: $209.05, the stated 20-day resistance.
- Stop-loss protection: Below $177.59, the lower Bollinger band.
For non-traders, the signals are mixed enough that the next move needs confirmation rather than assumption.
| Indicator | Reading |
|---|---:|
| Last price | $186.03 |
| SMA20 / SMA50 | $193.55 / $182.57 |
| Support / resistance | $183.09 / $209.05 |
| RSI(14) | 46.3, neutral |
| Stochastic %K / %D | 5.5 / 39.6, oversold |
| MACD histogram | -0.814, negative |
| Bollinger lower / upper | $177.59 / $209.51 |
| ATR(14) | $7.48; 4.0% |
| Volume / 20-day average | 33,253,300 / 23,114,800 |
| OBV | Rising |
Advertisement
Summary Data PLTR
Last price
186.03 USD
Change 1 day / 5 days / 1 month
-7.22% / -11.01% / 4.72%
Trend / MA-cross
sideways / none
SMA20 / SMA50
193.55 / 182.57
RSI (14) / Stochastic %K
46.3 / 5.5
Bollinger %B / ATR
26% / 7.48
Support / Resistance 20 days
183.09 / 209.05
Data as of
17 October 2026 03:00 WIB
Disclaimer: This technical analysis is generated automatically from exchange data (via Yahoo Finance) and indicators calculated by JournalArta, for information and education only. The verdict and the entry, target and stop-loss levels are not investment advice or a solicitation to buy or sell any security. Investment decisions and their risks rest solely with the reader.