Diageo Stock Gains 1.94% on Friday, RSI Overbought
On October 16, 2026: price 1,790.00 GBp, trend sideways, RSI 73.3, support 1,575.50, resistance 1,790.00. technical analysis of diageo stock.
By matthew jonathan
October 19, 20263 min read
Advertisement
Diageo Stock Gains 1.94% on Friday, RSI Overbought
Why Diageo is in focus today
Closed at a 20-day high (1,790.00)
RSI(14) at 73.3 — overbought zone
Selected automatically from 16 LSE (UK) stocks by a technical-signal score with daily weighted randomisation — not a recommendation.
Diageo’s shares closed at a 20-trading-day high, putting a sharp rebound in spirits stocks against a warning that momentum may be running hot. The London-listed shares ended at 1,790.00 GBp on 16 October, up 1.94% on the day and 9.28% over five days, according to market data sourced from the exchange. Yet the close also matched the 20-day resistance level, while the relative strength index (RSI), a measure of recent price momentum, reached 73.3, in overbought territory.
Advertisement
Trend & Price Action
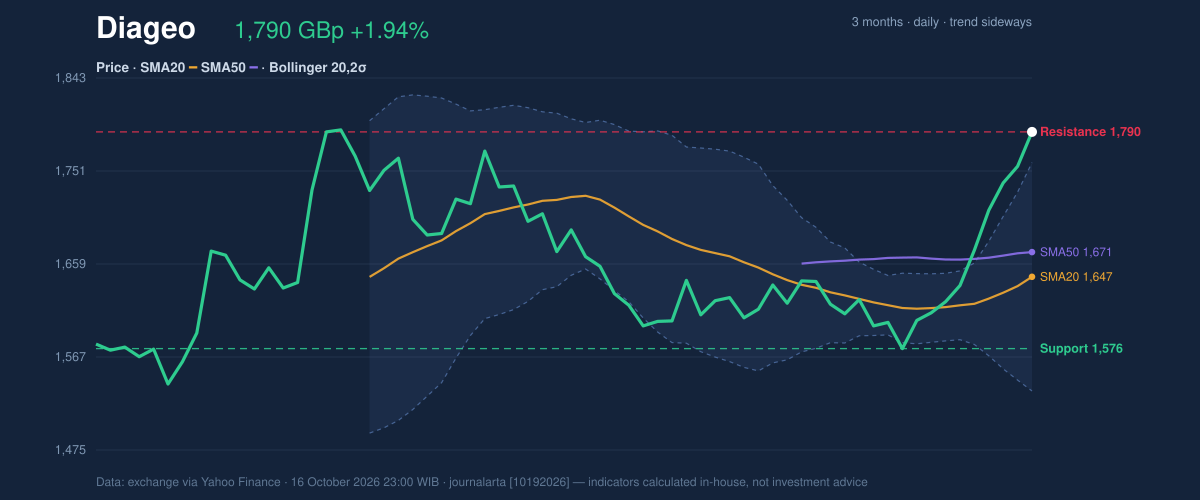
The move has lifted Diageo above its 20-day simple moving average (SMA), currently 1,646.60 GBp, while the 50-day SMA sits at 1,671.04 GBp. The 20-day average is rising, up 1.74% over five days, but the broader trend is still classified as sideways and there has been no recent moving-average crossover. That combination points to improving short-term price action without yet confirming a durable change in the larger trend.
The shares are also above the upper Bollinger Band, at 1,759.61 GBp. Bollinger Bands track a share’s movement around its average; a close beyond the upper band can signal strong buying pressure, but may also mean the price has stretched quickly. The band width is 13.7%, described as normal rather than unusually tight or wide. Diageo remains below its three-month high of 1,827.93 GBp.
The breakout is clear; its staying power is not.
As shown in the chart, price is at the top of its recent range, above both moving averages and beyond the upper Bollinger Band.
3-month price action chart of Diageo: price, SMA20/50, Bollinger, support & resistance. Data: exchange.
Advertisement
Oscillators & Momentum
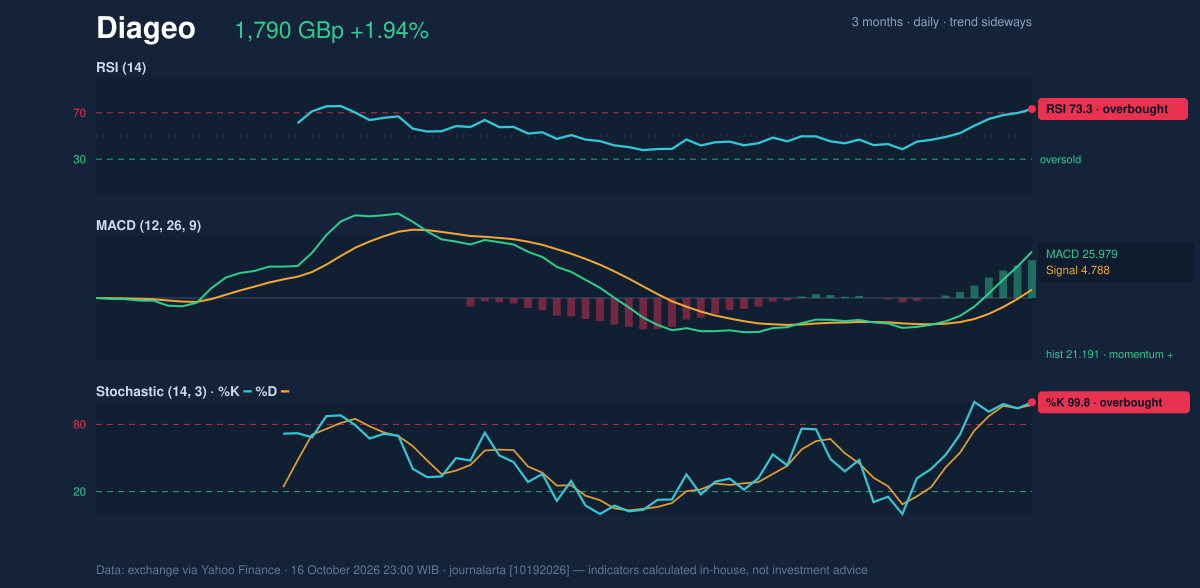
Momentum indicators reinforce the strength of the rebound, but also show why a pause would not be surprising. RSI at 73.3 is above the commonly watched 70 threshold. Stochastic %K at 99.8 and %D at 97.4 are also overbought; this oscillator compares a closing price with its recent trading range, so readings near 100 indicate that prices have been closing near the top of that range.
The MACD, a trend-following momentum measure, remains positive: its reading is 25.979 against a signal line of 4.788, leaving a positive histogram of 21.191. That supports the upward move rather than contradicting it. But overbought readings are not, by themselves, proof that a reversal has begun. They mean the price has advanced quickly and may be more vulnerable if buyers lose momentum.
Momentum chart of Diageo: RSI(14), MACD, Stochastic. Data: exchange.
Volatility, Volume & Key Levels
Trading volume was 3,717,775 shares, about 0.8 times the 20-day average of 4,783,907. The advance therefore came on below-average participation, tempering the strength of the price signal. On the other hand, On-Balance Volume (OBV), which uses volume to track buying and selling pressure, is rising. The two measures offer a mixed picture: accumulated volume supports the move, but the latest session did not bring an unusually large wave of trading.
Average True Range (ATR), a gauge of typical daily movement, is 37.49 GBp, or 2.1% of the share price, indicating moderate volatility. The immediate test is whether Diageo can hold above 1,790.00 GBp, the stated 20-day resistance and current range ceiling. A sustained move beyond it would put the three-month high of 1,827.93 GBp in view; failure to hold the breakout would bring the moving averages into focus, with the 50-day SMA at 1,671.04 GBp and the 20-day SMA at 1,646.60 GBp. The stated 20-day support is 1,575.50 GBp.
Advertisement
Technical Verdict: HOLD
HOLD (wait & see) is the clearest reading of the mixed signals. The rising SMA20 and positive MACD support the advance; RSI and Stochastic are overbought, while below-average volume makes the latest push less convincing. The verdict is invalidated if price falls below 1,575.50 GBp, the stated 20-day support.
Ideal entry range: 1,646.60–1,671.04 GBp, around the 20- and 50-day moving averages.
Exit target: 1,827.93 GBp, the three-month high.
Stop-loss protection: 1,575.50 GBp, the 20-day support level.
In plain English, the rebound is strong, but the indicators suggest waiting for clearer confirmation that it can hold.Summary Data Diageo
Last price
1,790.00 GBp
Change 1 day / 5 days / 1 month
1.94% / 9.28% / 11.46%
Trend / MA-cross
sideways / none
SMA20 / SMA50
1,646.60 / 1,671.04
RSI (14) / Stochastic %K
73.3 / 99.8
Bollinger %B / ATR
113% / 37.49
Support / Resistance 20 days
1,575.50 / 1,790.00
Data as of
16 October 2026 23:00 WIB
Disclaimer: This technical analysis is generated automatically from exchange data (via Yahoo Finance) and indicators calculated by JournalArta, for information and education only. The verdict and the entry, target and stop-loss levels are not investment advice or a solicitation to buy or sell any security. Investment decisions and their risks rest solely with the reader.