AMD Testing Support Level: Stock Drops 5.95% (October 16, 2026)
On October 16, 2026: price 528.75 USD, trend sideways, RSI 37.8, support 528.75, resistance 649.42. technical analysis of amd stock.
By Elena Vance
October 19, 20264 min read
Advertisement
AMD Testing Support Level
Why AMD is in focus today
Closed at a 20-day low (528.75)
Selected automatically from 32 NASDAQ (US) stocks by a technical-signal score with daily weighted randomisation — not a recommendation.
For international investors, AMD’s sharp retreat places the chipmaker at a near-term technical test: shares closed at the lowest level of the past 20 trading days as selling pressure outweighed signs that the stock may be oversold.
AMD ended at $528.75 on Nasdaq, down 5.95% in one day and 13.05% over five days, according to market data for October 17, 2026, at 03:00 WIB. The stock also fell 5.55% over the past month. Its close matched the stated 20-day support level, leaving little room for that level to absorb further selling without being tested again.
Advertisement
Trend & Price Action
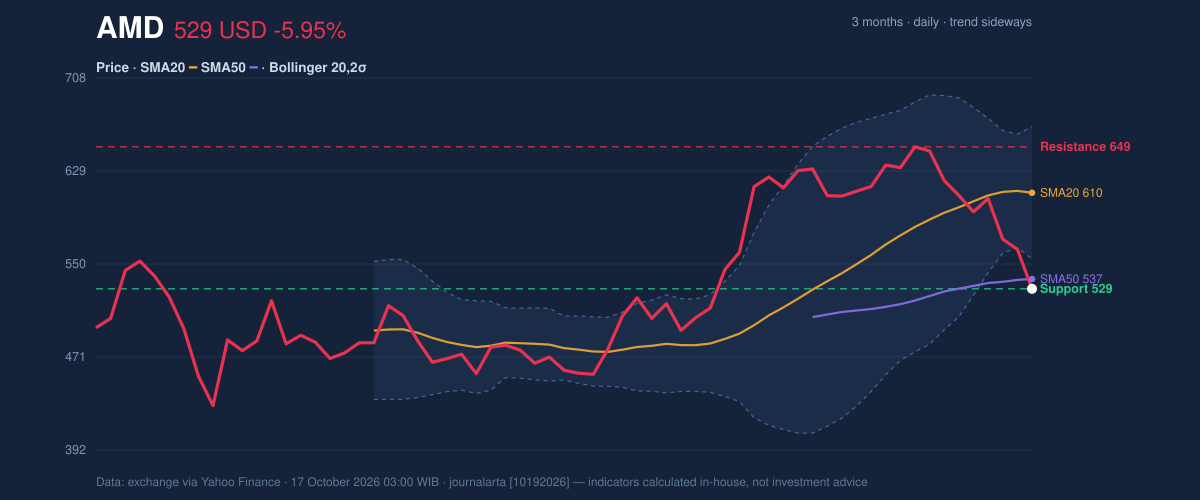
The short-term picture has weakened. AMD trades below its 20-day simple moving average, or SMA20, at $610.40 and its 50-day average at $537.14. A moving average smooths daily price changes to make the broader direction easier to see; trading below both suggests recent weakness, although the data show no new crossover between the averages. The SMA20’s slope remains positive at 2.06% over five days, a sign that the average has not yet turned down despite the price decline.
The gap between price and SMA20 is substantial, while the share price is also below the lower Bollinger Band at $554.24. Bollinger Bands mark a range around an average price; a close below the lower band can indicate unusually strong downside pressure, but does not by itself confirm a reversal. The band width is 18.4%, described as normal, so the move is not accompanied by a reported squeeze or exceptional expansion in the bands.
As shown in the chart, the price sits at the bottom of its stated 20-day range, with resistance at $649.42. Over the past three months, AMD has traded between $424.03 and $658.52, placing the current close above the period low but well below the high.
3-month price action chart of AMD: price, SMA20/50, Bollinger, support & resistance. Data: exchange.
Advertisement
Oscillators & Momentum
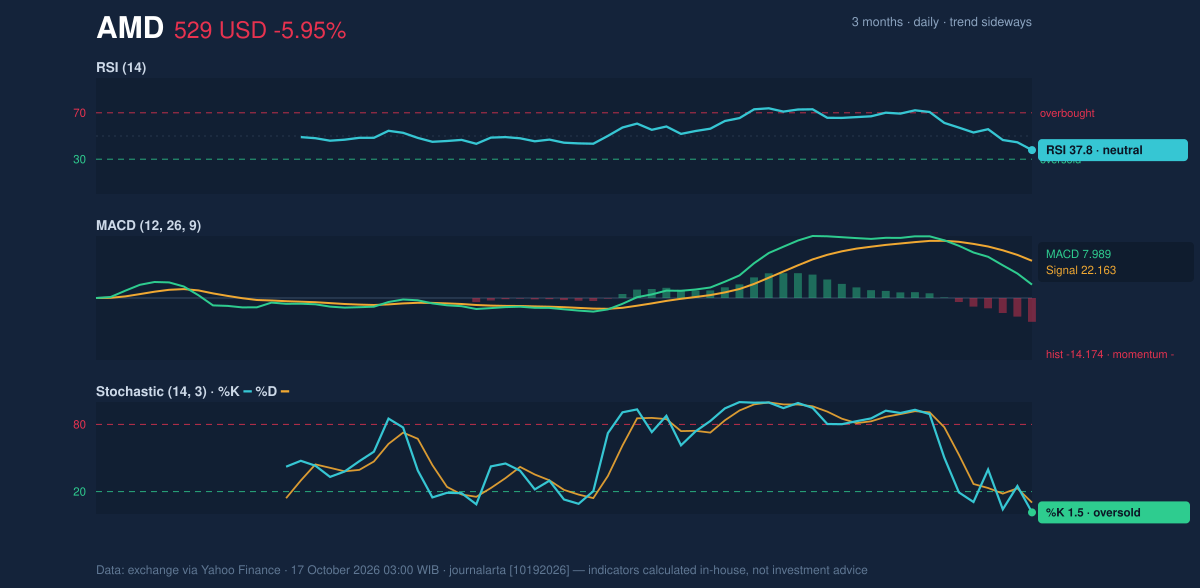
Momentum indicators reinforce the warning from the price structure, though one is flashing an oversold reading. The relative strength index, or RSI, is 37.8, a neutral reading; it suggests weakness without reaching the conventionally extreme lower zone. The Stochastic oscillator, which compares a recent close with its price range, is more stretched: %K at 1.5 and %D at 10.2 are oversold. Such readings can precede a bounce, but they are not proof that selling has ended.
The MACD, a trend-following measure that compares moving averages, remains negative in its shorter-term signal: the histogram is -14.174, with MACD at 7.989 below its signal line at 22.163. That gap indicates downside momentum is still dominant. In plain terms, the Stochastic points to a market that has fallen quickly, while MACD says the decline has not yet shown a clear technical turn.
Momentum chart of AMD: RSI(14), MACD, Stochastic. Data: exchange.
Volatility, Volume & Key Levels
AMD’s average true range, a measure of typical daily price movement, is $26.28, or 5.0% of the share price—elevated volatility that can make support tests less orderly. Volume reached 22,481,800 shares, about 1.1 times the 20-day average of 21,257,385. That above-average activity gives the decline more weight than a drop on thin trading would, while falling on-balance volume (OBV) indicates cumulative volume has weakened alongside price.
The immediate reference is $528.75 support, the stated 20-day floor and AMD’s closing level. A sustained break below it would put the three-month low at $424.03 in view as a broader historical reference, not as a guaranteed destination. On a recovery, the lower Bollinger Band at $554.24 and the SMA50 at $537.14 are nearby technical markers, while $649.42 is the stated 20-day resistance. A move back above the SMA20 at $610.40 would be a more meaningful sign that short-term structure is repairing.
Advertisement
Technical Verdict: HOLD (wait & see)
The indicators support a wait-and-see reading rather than a directional call. First, price is below both moving averages and has closed at 20-day support. Second, MACD momentum remains negative, with a declining OBV adding evidence of selling pressure. Third, the Stochastic is oversold, which raises the possibility of a rebound but does not confirm one.
The verdict is invalidated if AMD falls below $528.75, the stated 20-day support. Technical reference levels—not investment instructions—are:
Ideal entry range: $537.14–$554.24, around the SMA50 and lower Bollinger Band, if price stabilizes in that area.
Exit target: $610.40, the SMA20; $649.42 is the next stated resistance reference.
Stop-loss protection: below $528.75, the current 20-day support.
In plain English, AMD’s chart shows a sharp decline with an oversold signal, but not yet a confirmed recovery.
Summary Data AMD
Last price
528.75 USD
Change 1 day / 5 days / 1 month
-5.95% / -13.05% / -5.55%
Trend / MA-cross
sideways / none
SMA20 / SMA50
610.40 / 537.14
RSI (14) / Stochastic %K
37.8 / 1.5
Bollinger %B / ATR
-23% / 26.28
Support / Resistance 20 days
528.75 / 649.42
Data as of
17 October 2026 03:00 WIB
Advertisement
Disclaimer: This technical analysis is generated automatically from exchange data (via Yahoo Finance) and indicators calculated by JournalArta, for information and education only. The verdict and the entry, target and stop-loss levels are not investment advice or a solicitation to buy or sell any security. Investment decisions and their risks rest solely with the reader.