ORCL Stock Technicals Today: Gains 3.06%, Momentum Weakens
On Oktober 5, 2026: price 142.30 USD, trend sideways, RSI 48.4, support 132.60, resistance 162.52. technical analysis of orcl stock.
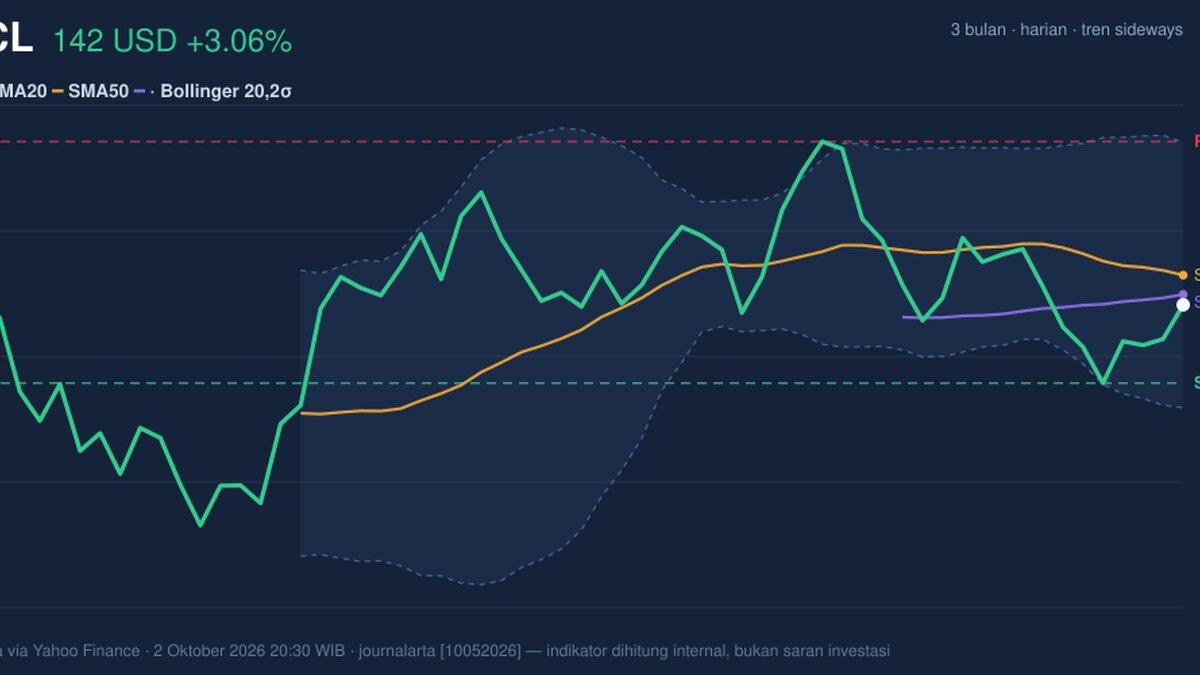
Oracle is trading in a market where the tape is still positive on the day, but the longer signal is less friendly: the stock finished at 142.30 USD, above the prior close of 138.07, yet still below its short-term trend markers, which tells international readers this is not a clean breakout but a stock trying to recover inside a broader pause.
Oracle’s shares rose 3.06% in the latest session and are up 3.79% over five days, but they remain down 7.62% over one month, according to the latest market data. That mix matters: short bursts of strength are visible, but they have not yet repaired the weaker monthly structure. The price is still trading below SMA20 at 145.98 and also below SMA50 at 143.59, which means the stock is sitting under both its near-term and intermediate trend gauges. In plain language, the market has not yet proven that the recent bounce is strong enough to change the broader direction.
Trend & Price Action
The chart shows Oracle in a sideways trend, and the slope of the SMA20 at -1.78% over 5 days reinforces that the short-term path is still leaning lower rather than rising. The absence of a fresh MA-cross also matters: without a new crossover, there is no technical confirmation that buyers have taken control from sellers. The stock is trading at about 32% of the 20-day range between support at 132.60 and resistance at 162.52, which places it in the lower half of that band rather than near the top where momentum would usually look more convincing.
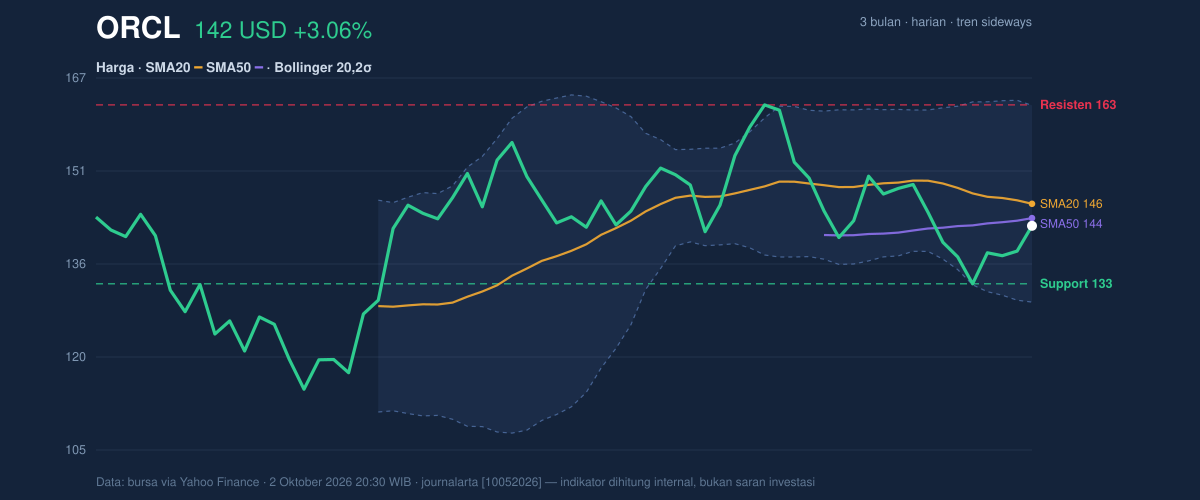
The broader three-month range adds context. Oracle has traded between 114.50 and 170.70 over that period, so the current price is no longer near the lows, but it is also far from the upper end. That positioning suggests the market is still deciding whether the recent rebound is just a pause in a larger consolidation or the start of a more durable repair.
A bounce, yes. A trend change, not yet.
Oscillators & Momentum
Momentum indicators are mostly neutral, which is important because neutral readings often mean the market is waiting for a catalyst rather than already committing to a direction. The RSI at 48.4 sits close to the middle of its scale, signaling neither overbought nor oversold conditions. That tells us the stock is not stretched enough to force a reversal, but also not weak enough to suggest panic selling. The Stochastic %K at 48.7 and %D at 31.6 are also in neutral territory, though the gap between the two lines can be read as a tentative improvement in short-term buying pressure.
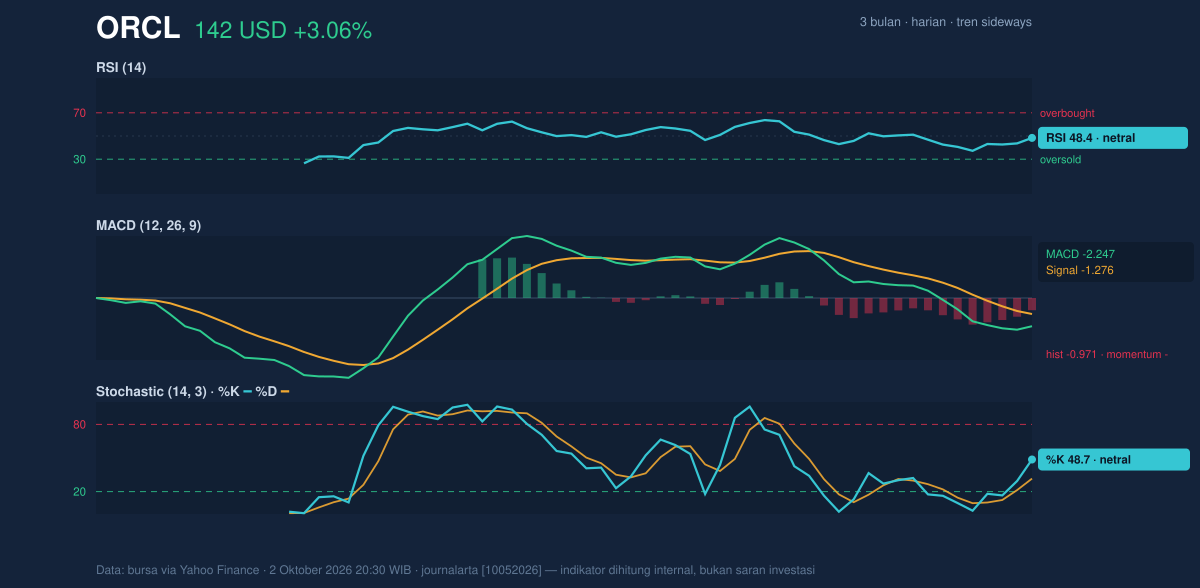
The more important signal is the MACD at -2.247, with the signal line at -1.276 and a histogram of -0.971. MACD is a trend-following momentum tool, and a negative histogram means downside momentum still outweighs upside impulse. In simple terms, the stock may be stabilizing, but the engine is still running below neutral. That is why the recent gain has not yet translated into a stronger technical posture.
Volatility & Volume
Oracle is also moving in a more volatile environment. The Bollinger Bands are spread between 162.42 on the upper side and 129.54 on the lower side, with the middle band at 145.98. The band width of 22.5% and the note that volatility is high matter because widening bands often mean the stock is capable of larger swings in either direction. The %B at 39% shows the price is sitting below the middle of the band structure, which usually indicates the market has not yet reclaimed the central trend line that often acts as a pivot.
Volume does not yet confirm a strong conviction move. The latest volume of 35,330,300 is almost exactly in line with the 20-day average of 36,279,495, or 1.0x normal. That means the move higher did not arrive with a surge of participation. More importantly, OBV is falling, and that is a warning sign: on-balance volume tracks whether money flow is accumulating or leaving the stock, so a declining OBV suggests sellers have had the edge even when price has tried to stabilize.
Volatility is elevated, but participation is not yet decisive.
Key Levels & Scenarios
The nearest technical floor is 132.60, while the nearest ceiling is 162.52. Those levels frame the current battle. If Oracle can reclaim the 145.98 SMA20, it would improve the case that the recent bounce is gaining traction, because the middle Bollinger band often acts as a short-term dividing line between weakness and recovery. If it fails to hold above 132.60, the chart would lose an important support zone and the sideways pattern would start to look more vulnerable.
The key point is that the stock is not trapped in a narrow box; it is moving inside a wide range, and the next decisive move is likely to come only when one of these boundaries gives way.
Technical Verdict: HOLD (wait & see)
Why this verdict fits the chart:
- RSI 48.4 and Stochastic 48.7 / 31.6 are neutral, so momentum is not strong enough to confirm a new uptrend.
- MACD -2.247 with a negative histogram still points to bearish momentum underneath the recent rebound.
- Price remains below SMA20 at 145.98 and below SMA50 at 143.59, while OBV is falling, which weakens the case for sustained accumulation.
Verdict invalidated if price breaks above 162.52, because that would challenge the current range ceiling and materially improve trend structure.
- Ideal Entry Range: 132.60 to 145.98
- Exit Target: 162.52
- Stop Loss Protection: 129.54
For non-traders, this means Oracle is not showing enough technical strength yet to call the bounce complete, but it is also not weak enough to assume the recovery has failed.
“The market is still waiting for proof.”
Summary Data ORCL
| Last price | 142.30 USD |
| Change 1 day / 5 days / 1 month | 3.06% / 3.79% / -7.62% |
| Trend / MA-cross | sideways / none |
| SMA20 / SMA50 | 145.98 / 143.59 |
| RSI (14) / Stochastic %K | 48.4 / 48.7 |
| Bollinger %B / ATR | 39% / 6.34 |
| Support / Resistance 20 days | 132.60 / 162.52 |
| Data as of | 2 Oktober 2026 20:30 WIB |